
TL;DR
I built a lead scoring system that ingests three families of signals for every lead in the pipeline: behavioral data (website visits, pricing page views, demo requests), email engagement (clicks, opens, unsubscribes), and firmographic data (job title, company size, decision-maker status). It combines these signals into a conversion probability and assigns every lead to one of four action tiers: Hot, Warm, Nurture, and Suppress. The system is built with Python, FastAPI, and Streamlit, and runs in production at a fraction of what tools like HubSpot or Pipedrive charge — and delivers capabilities they don’t offer out of the box.
The Problem
Your sales team starts the week with 200 leads. Some came from the pricing page. Some downloaded a whitepaper six months ago. Some attended a webinar. A few are decision-makers at companies that fit your ICP perfectly. Most are not.
Without a system, the default is gut feel and whoever shouted loudest last. Reps spend Monday chasing leads that haven’t opened an email in weeks, while the prospect who visited the pricing page three times this month waits until Thursday — by which point they’ve already booked a demo with a competitor.
The cost isn’t just missed deals. It’s the invisible tax on every salesperson’s week: time spent on low-intent prospects who were never going to convert, while high-intent leads go cold.
The question is simple: what if you could know, before making a single call, which leads are worth your team’s time?
What the System Does
The lead scoring system ingests three families of signals for every lead in the pipeline: behavioral data (website visits, pricing page views, demo requests), email engagement (clicks, opens, unsubscribes), and firmographic data (job title, company size, decision-maker status). It combines these signals into a conversion probability and assigns every lead to one of four action tiers:
- Hot — call within 2 hours
- Warm — follow up within 24 hours
- Nurture — weekly touch, not urgent
- Suppress — remove from active pipeline
Critically, every scored lead comes with a plain-English explanation: the top three reasons it scored high, and any risk factors dragging it down. Sales reps don’t just get a number — they get context. A rep who understands why a lead is hot is far more likely to trust the system and act on it than one handed an opaque score with no rationale.
The Results
The numbers make the business case clearly:
Hot + Warm leads represent just 38% of the pipeline — but capture 64% of all conversions.
Breaking it down by tier:
| Tier | Share of Pipeline | Conversion Rate | Conversions Captured |
|---|---|---|---|
| Hot | 12% | 58.5% | 27% |
| Warm | 26% | 36.2% | 37% |
| Nurture | 39% | 18.5% | 28% |
| Suppress | 23% | 8.2% | 7% |
The Hot tier converts at more than double the overall baseline rate. The top 20% of scored leads capture over 50% of all conversions.
A sales team following this system could focus on fewer than half their leads and still reach nearly two-thirds of the deals. That is not a marginal efficiency improvement — it is a structural shift in how the team operates.
The Suppress tier is equally valuable. At an 8.2% conversion rate, spending active sales time on those leads is provably wasteful. The system doesn’t just tell you who to call — it tells you who to stop calling.
How It Works
Data & Feature Engineering
The model is trained on 33 signals across three families. Behavioral signals — pricing page visits, demo requests, trial engagement — carry the heaviest weight because they are the hardest to fake and the most predictive of intent. Email engagement is included, with clicks weighted more heavily than opens: clicks require deliberate action; opens can be accidental or auto-triggered by mail clients.
Firmographic signals (decision-maker flag, company size, job title) provide context. One of the more interesting findings from the feature engineering stage: a decision-maker who visited the pricing page earns a bonus multiplier — the interaction effect between those two signals is more predictive than either signal in isolation.
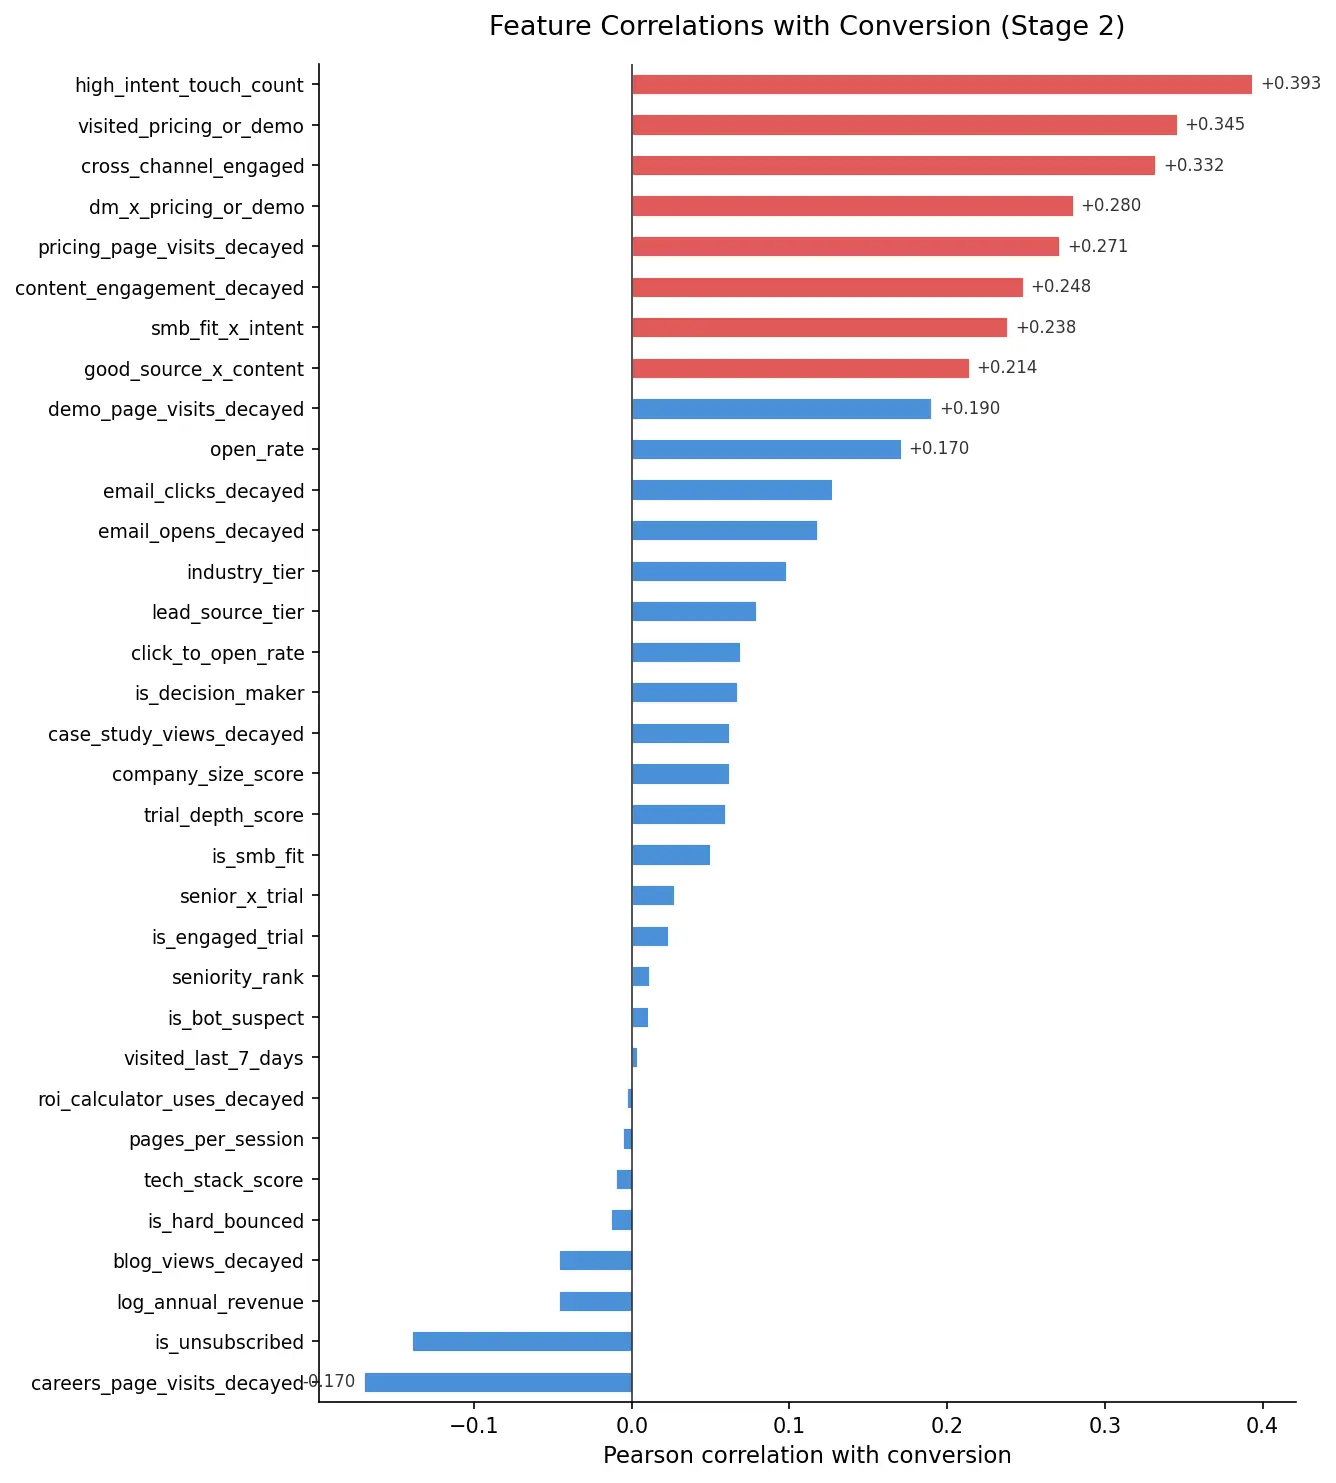 Correlation matrix of 33 features
Rule-Based Baseline
Before training any ML model, I built a hand-crafted rule system from the same 33 signals — assigning point weights to each signal based on its correlation with conversion, with asymmetric penalties for negative signals like unsubscribes (–20 points) and careers page visits. The goal was to establish a credible baseline: something a domain expert might actually build and ship.
The result was AUC 0.739 — well above random (0.50) and already good enough to be useful. Hot + Warm leads under the rule system captured 64% of conversions, and the Hot tier alone converted at 58.5%. This mattered for two reasons: it validated that the underlying signal structure in the data was strong, and it set a meaningful bar for the ML layer to beat.
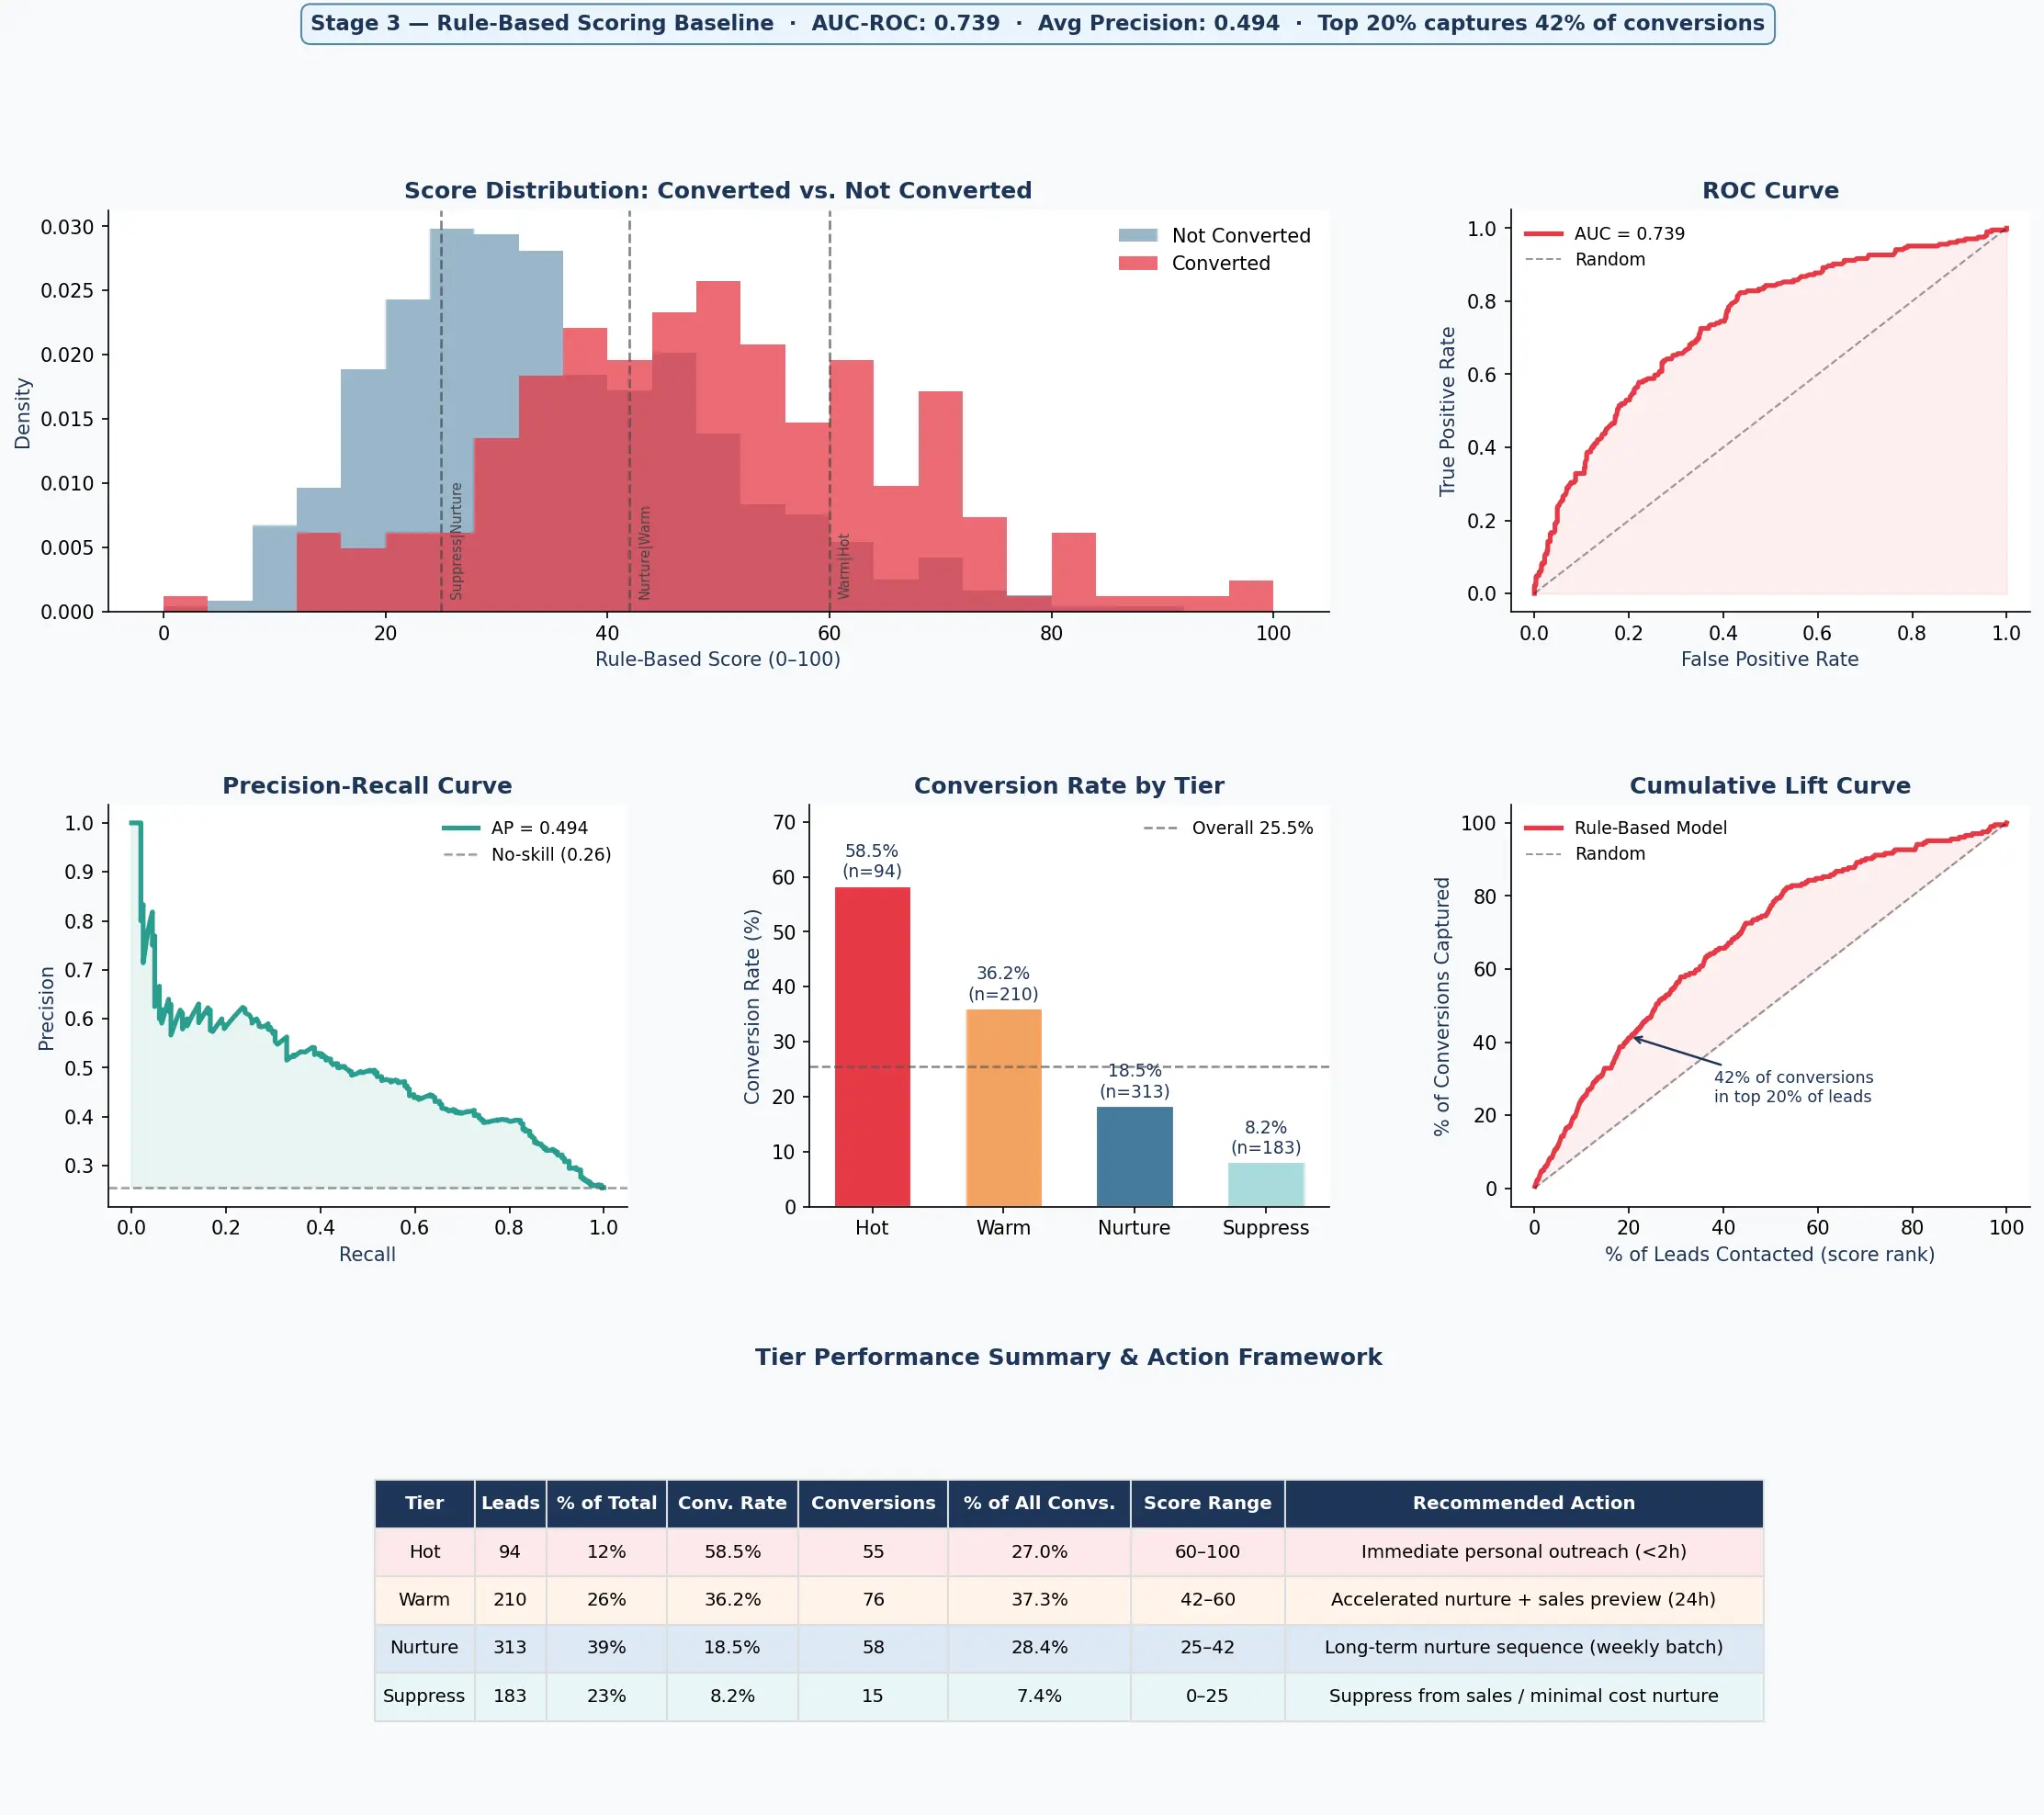 Rule-based baseline performance
Modeling
With the baseline established, two models were trained and compared head-to-head: Logistic Regression and Random Forest, evaluated using 5-fold cross-validation to produce honest out-of-sample metrics.
Logistic Regression won (AUC 0.789 vs. 0.777). The reason is dataset size: at 800 leads, a well-regularised linear model generalises better than a tree ensemble that needs more data to reliably exploit non-linear interactions. More model complexity is not always better — it has to be justified by the data. The production model is the simpler one, and it meaningfully outperforms the hand-crafted baseline.
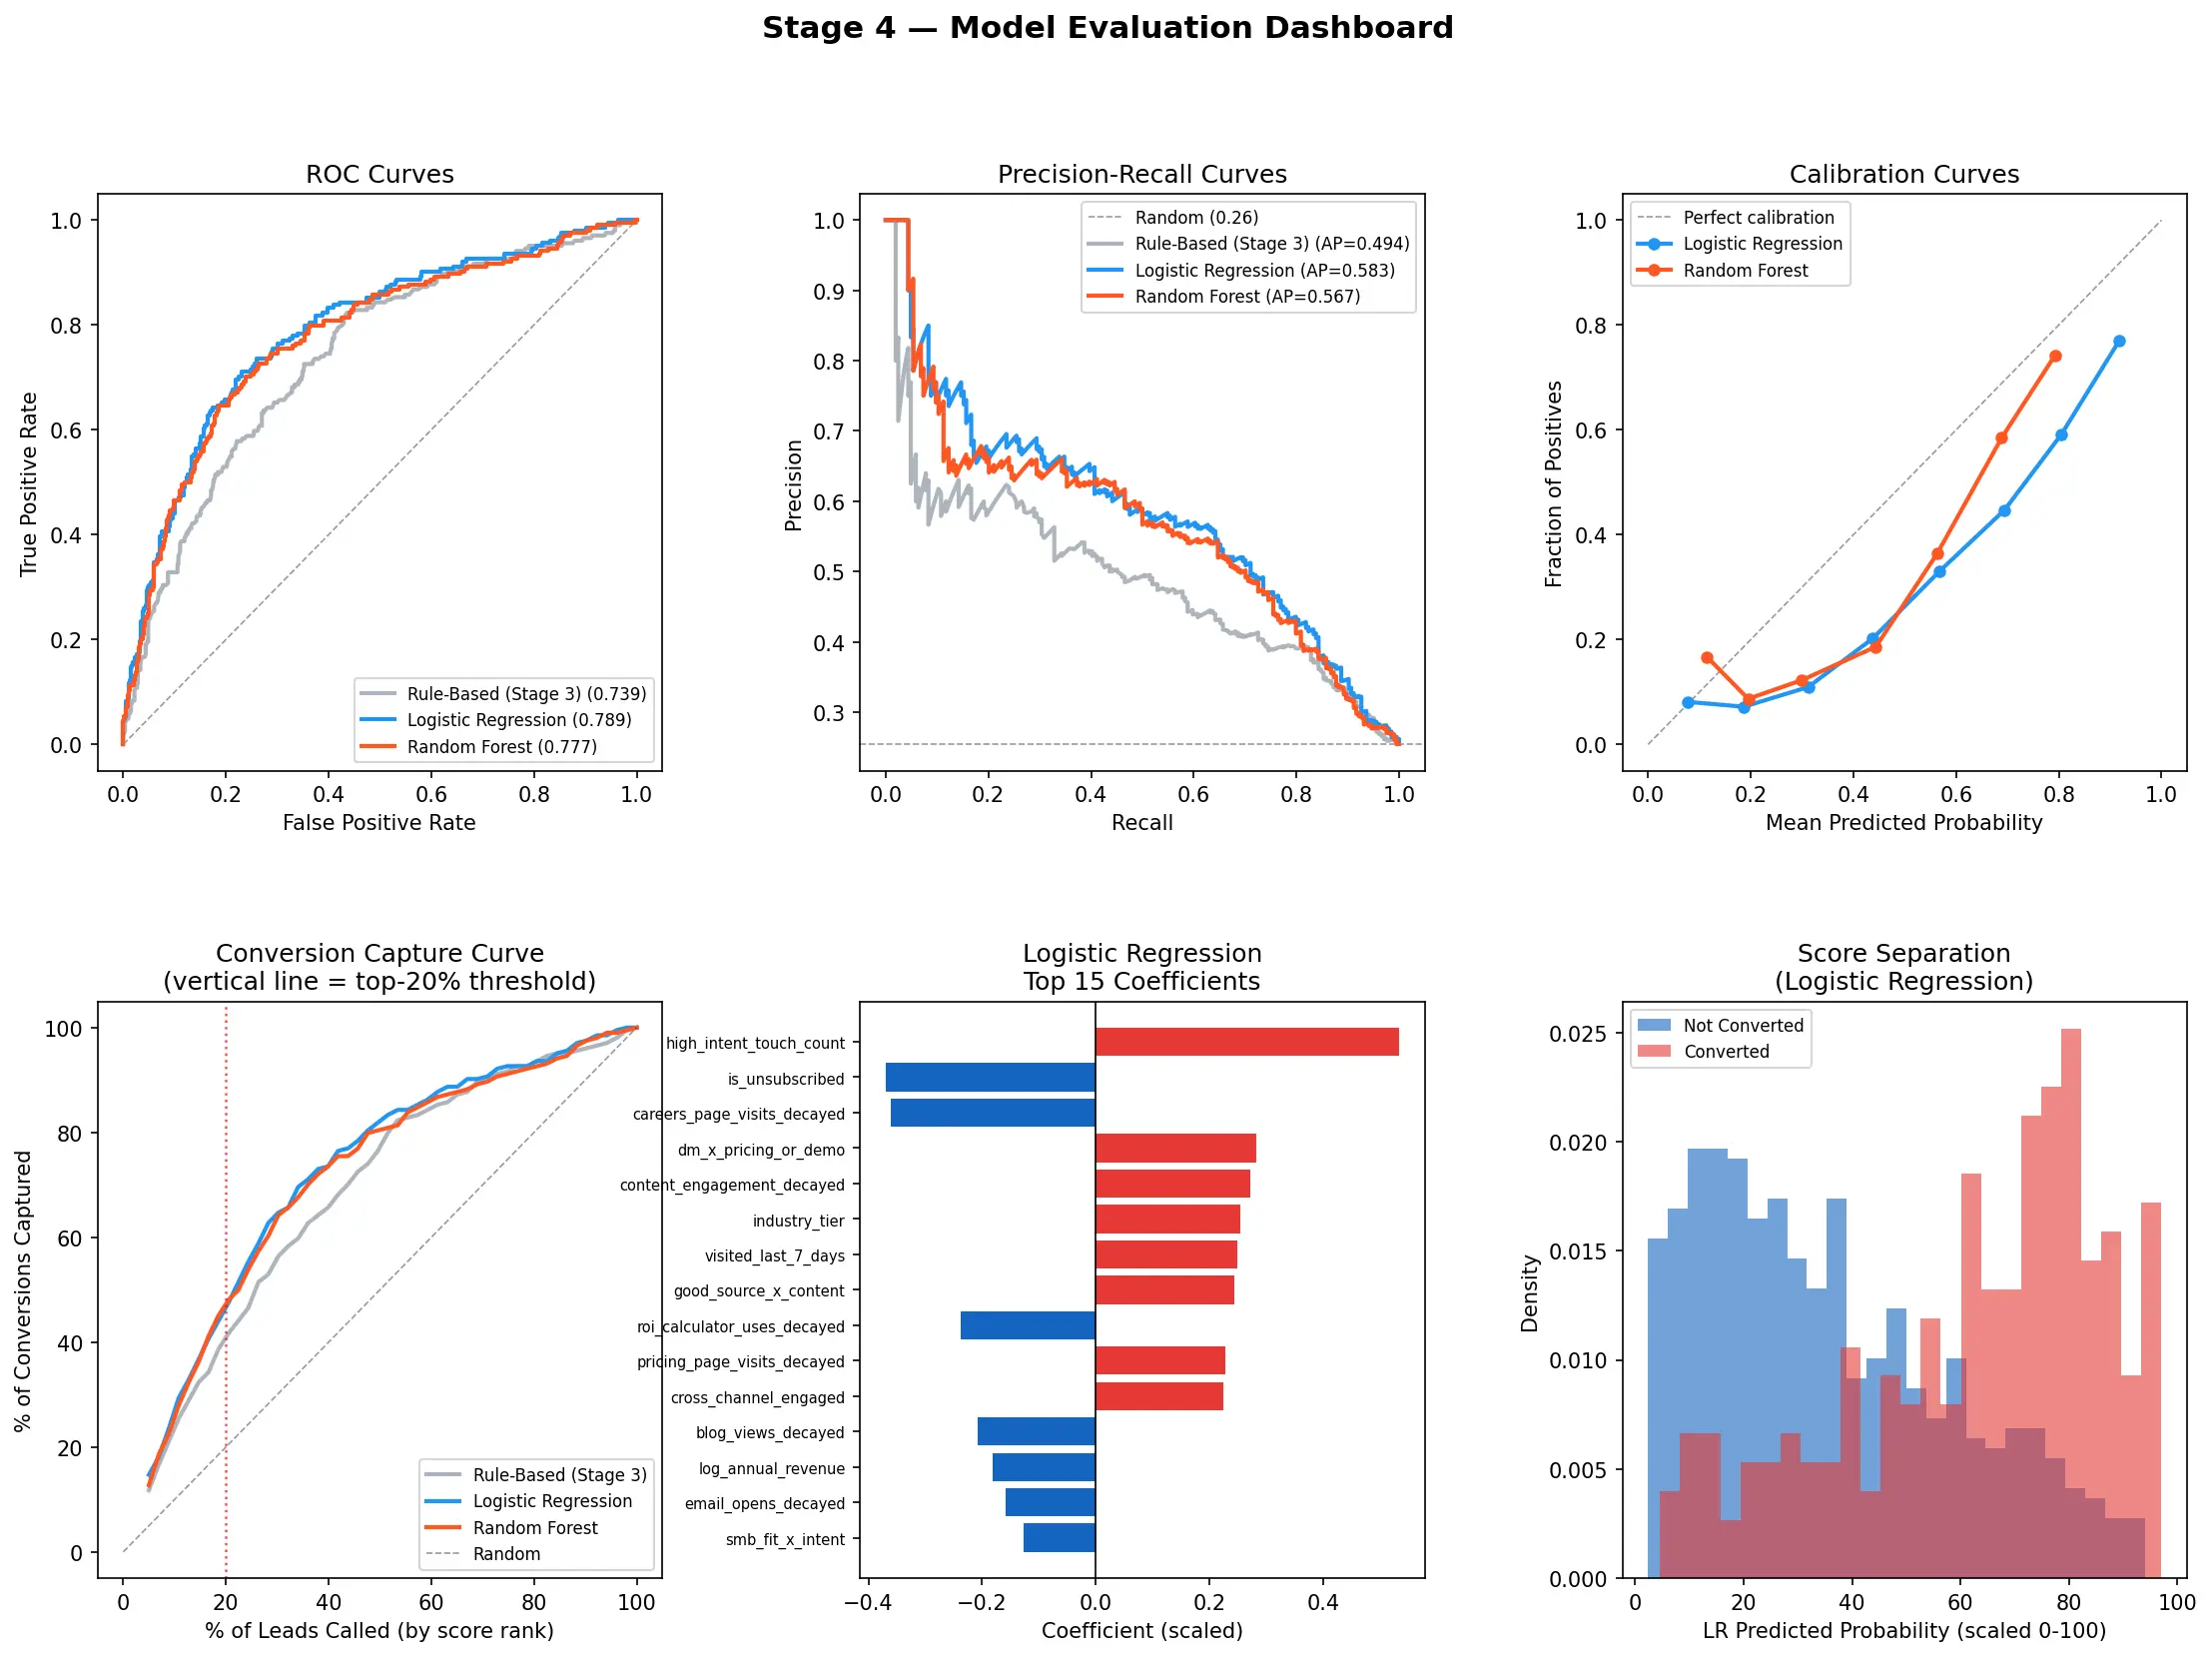 Model evaluation dashboard. Baseline vs ML models
Explainability
SHAP (SHapley Additive exPlanations) values are computed for every lead at scoring time. Each output includes the top positive signals driving the score and any negative signals suppressing it — rendered as plain English, not coefficient values.
This matters for adoption. A system that produces unexplained scores creates friction: reps second-guess it, managers override it, and the business value erodes. Explainability is not a nice-to-have — it is a prerequisite for a scoring system that actually gets used.
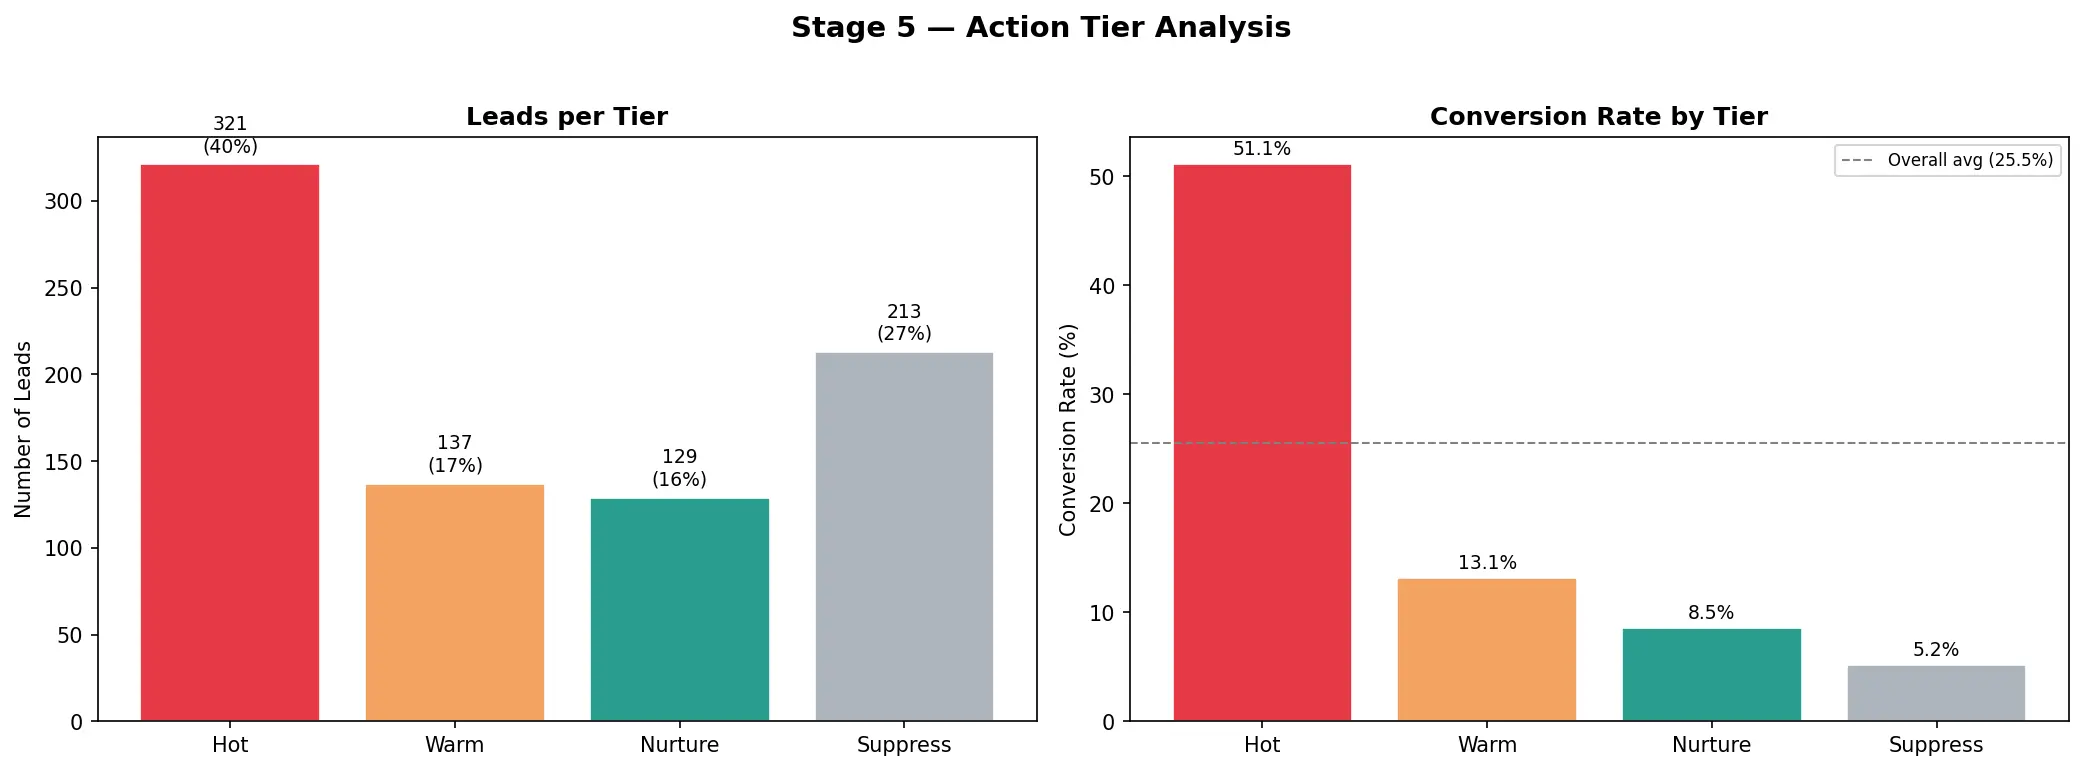 Tier analysis. Distribution of scores by tier
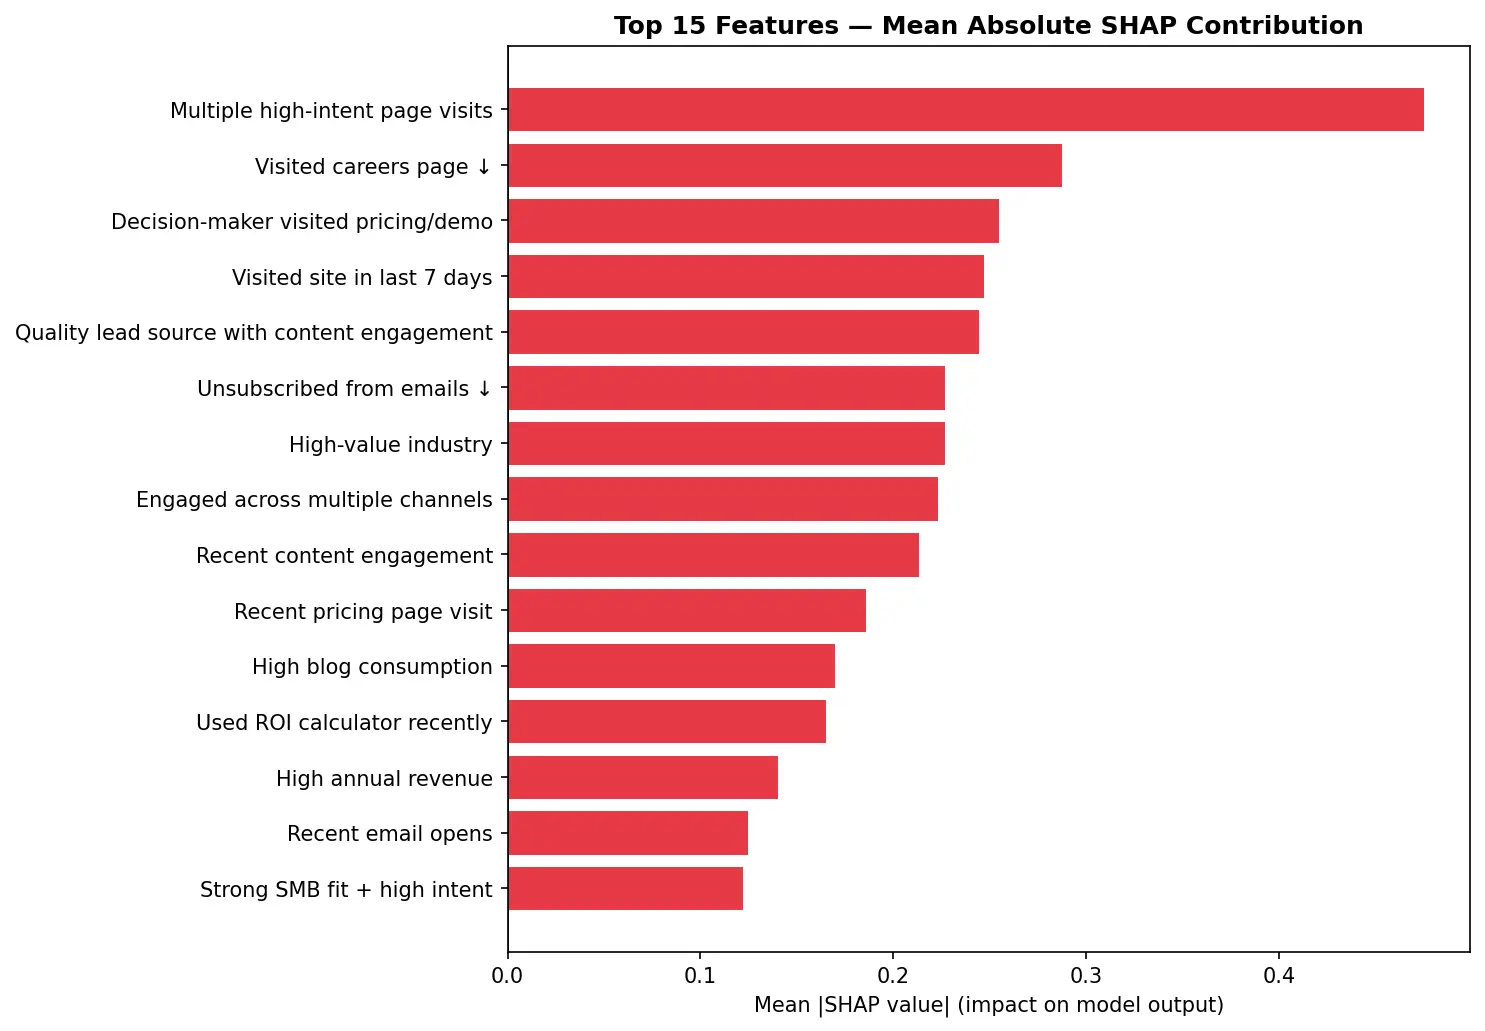 SHAP importance. Top 15 features and the impact on the score
Tech Stack
- Python / scikit-learn / SHAP — modeling, calibration, and per-lead explainability
- FastAPI — production API with single-lead scoring and CSV batch endpoints
- Streamlit — interactive dashboard for exploring scored leads and simulating new ones
- Docker + GCP Cloud Run — containerised, deployed, and auto-scaling
- Cloud Scheduler — automated weekly scoring runs, no manual intervention required
The system runs in production at a fraction of what tools like HubSpot or Pipedrive charge — and delivers capabilities they don’t offer out of the box.
Want This for Your Pipeline?
If your team is spending time on leads without knowing which ones are worth it, this is a solvable problem.
- See the code — GitHub repository
- Let’s talk — Contact