
Your Dashboard Is Lying to You
Your dashboard shows which channels are generating revenue. Your team uses those numbers to decide where to allocate next month’s budget. The process looks rational — but the model feeding those numbers is wrong.
Most e-commerce brands operate with Last-Touch Attribution, the default in Google Analytics and Shopify. The rule is simple: whichever channel the customer clicked last before purchasing receives 100% of the credit. Every other touchpoint in the journey — the ad that introduced the brand, the article that built the case, the email that warmed the lead — gets nothing.
It’s like handing the MVP trophy to the player who tapped the ball over the goal line, ignoring the three who made the entire play happen — ran the field, created the space, delivered the final pass. The goal still counts, but the credit for the scoreboard is wrong.
The consequences aren’t just theoretical. When Last-Touch says a channel is underperforming, you cut it. When it says a channel is delivering, you scale it. If the model you’re using is lying, every one of those decisions makes the error worse.
To measure exactly how much damage this causes, I audited more than 35,000 multi-touch customer journeys that generated $509,237 in revenue from an e-commerce dataset, running the same data through six different attribution models to see where the numbers diverged.
The result was worse than expected: $216,317 — 42.5% of total revenue — was recorded in the wrong channels.
Then I rebuilt the attribution from scratch.
Act 1: The Obvious Models Disagreed With Each Other
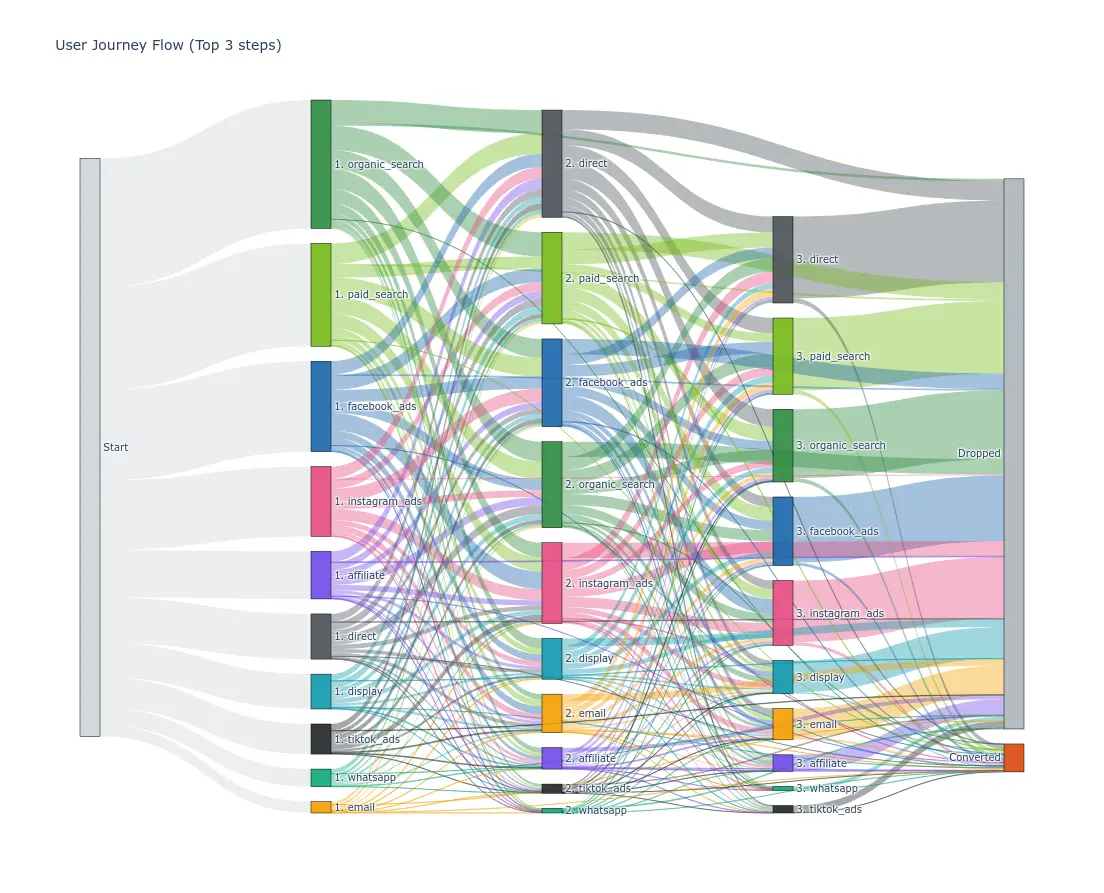 Customer journey in the first 3 stages of the dataset
The first step was running all the standard heuristic attribution models across the same 35,000 journeys. These models are rule-based — someone decided how credit should be distributed, and the formula follows that decision mechanically.
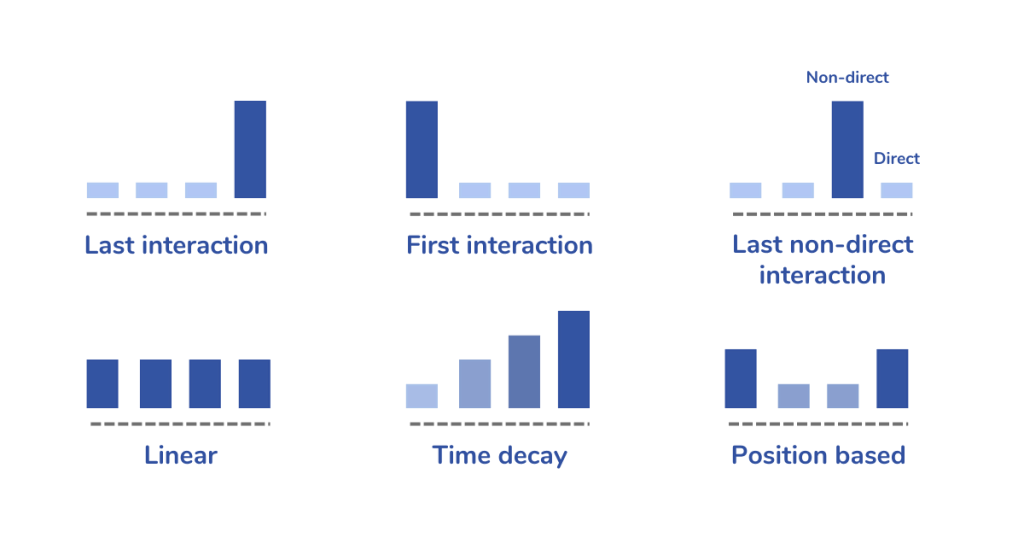
First-Touch credits 100% of revenue to the channel that introduced the customer to the brand. It’s useful for measuring awareness — which channels are attracting new audiences. It’s useless for measuring what actually closes the sale.
Last-Touch does the opposite: 100% of the credit goes to the last click before purchase. It’s the Google Analytics default. It rewards whoever closes and ignores all the work that came before.
Linear splits revenue equally across all touchpoints in the journey. A five-step journey assigns 20% to each channel. It treats the channel that closed the deal identically to the channel that first created awareness. Useful when all touchpoints genuinely matter equally. Terrible when they don’t — which is most of the time.
U-Shape (Position-Based) gives 40% to the first touch, 40% to the last, and divides the remaining 20% across everything in between. It’s a compromise that acknowledges discovery and closing both matter — but the 40/20/40 split is arbitrary. Someone chose those weights; no data did.
Time Decay weights more recent touchpoints more heavily than earlier ones. The logic is intuitive: a channel that touched the customer yesterday probably had more influence than one that touched them three weeks ago. The decay rate is a parameter someone chose — not something derived from actual customer behavior.
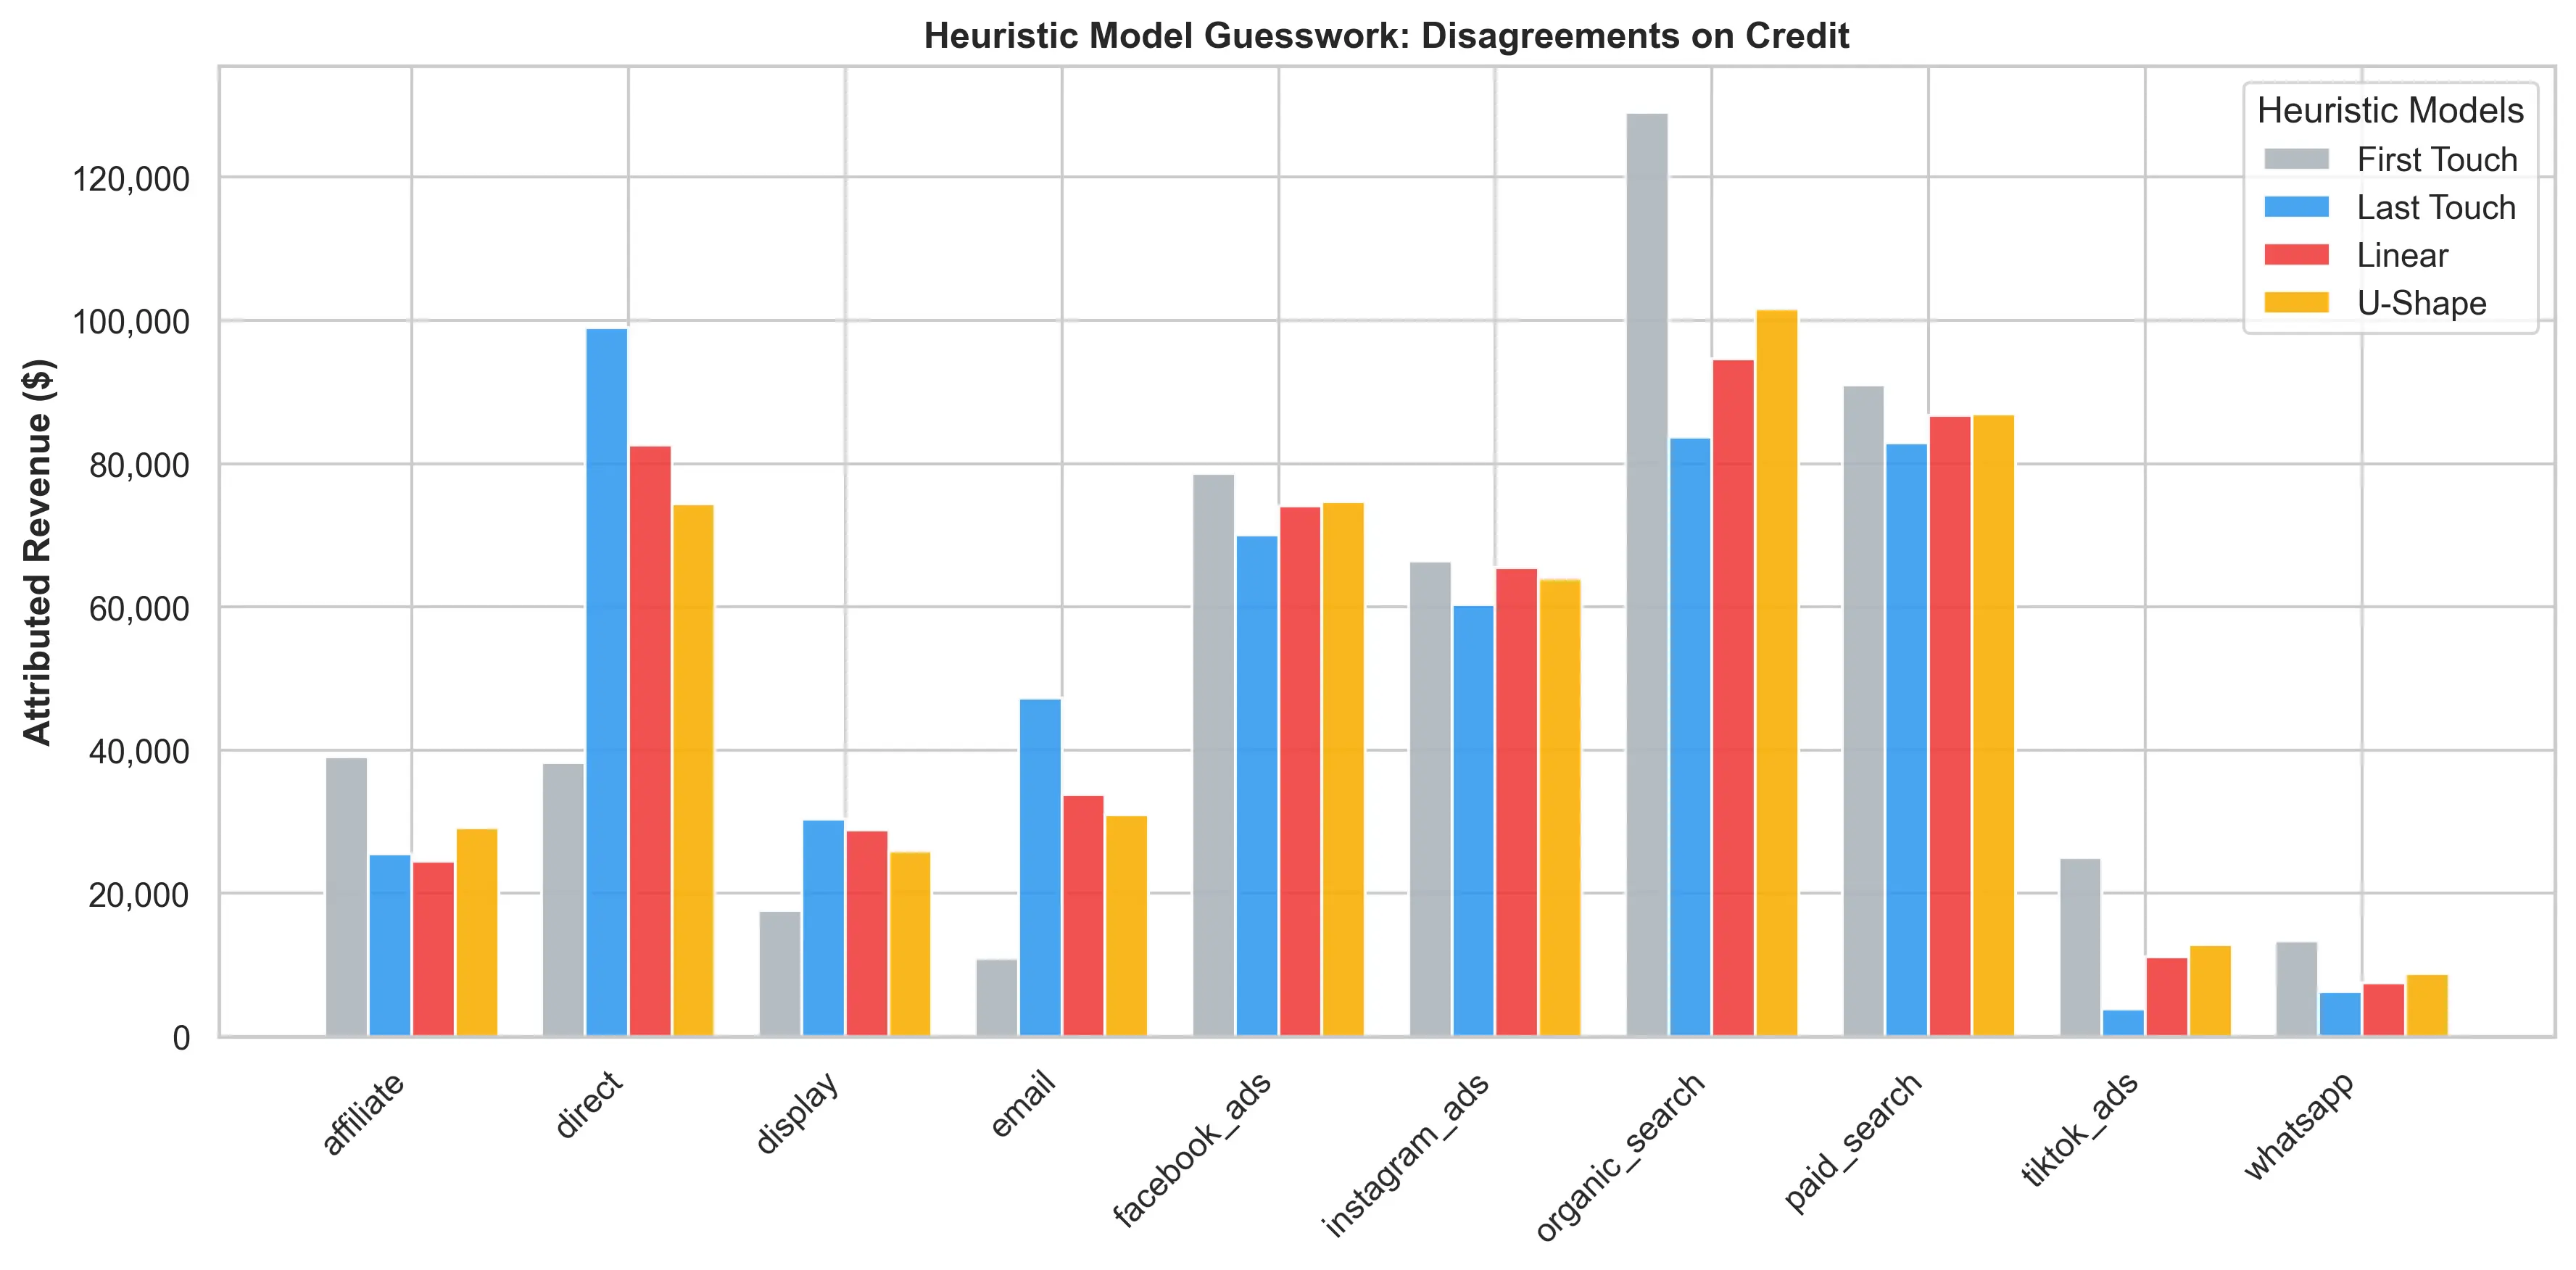
The chart above makes the problem plain before any sophisticated model is needed. Look at TikTok Ads: Last-Touch attributes just $3,839 to the channel — the lowest figure in the entire table. First-Touch attributes $25,023. That gap isn’t statistical noise; it’s a 6x divergence between two equally simplistic rule-based models. When two reasonable models reach conclusions that opposite, it doesn’t mean one of them is right. It means the rules themselves are imposing stories the data doesn’t support.
The disagreement between models wasn’t noise — it was a signal that the rules themselves were imposing a story the data didn’t support.
Rule-based models reflect pre-set weights. What if the data had a different story to tell?
Act 2: Letting the Data Tell the Story
The next two models abandoned pre-defined weights entirely and derived credit from the structure of the observed customer journeys.
Markov Chain Attribution treats the dataset as a transition network — a probability model that maps the actual flow of users between channels. A customer goes from TikTok to Google Search, then to Email and converts — that path becomes a data point in a probabilistic graph. Repeat that across 35,000 journeys, and the graph encodes how real customers actually move.

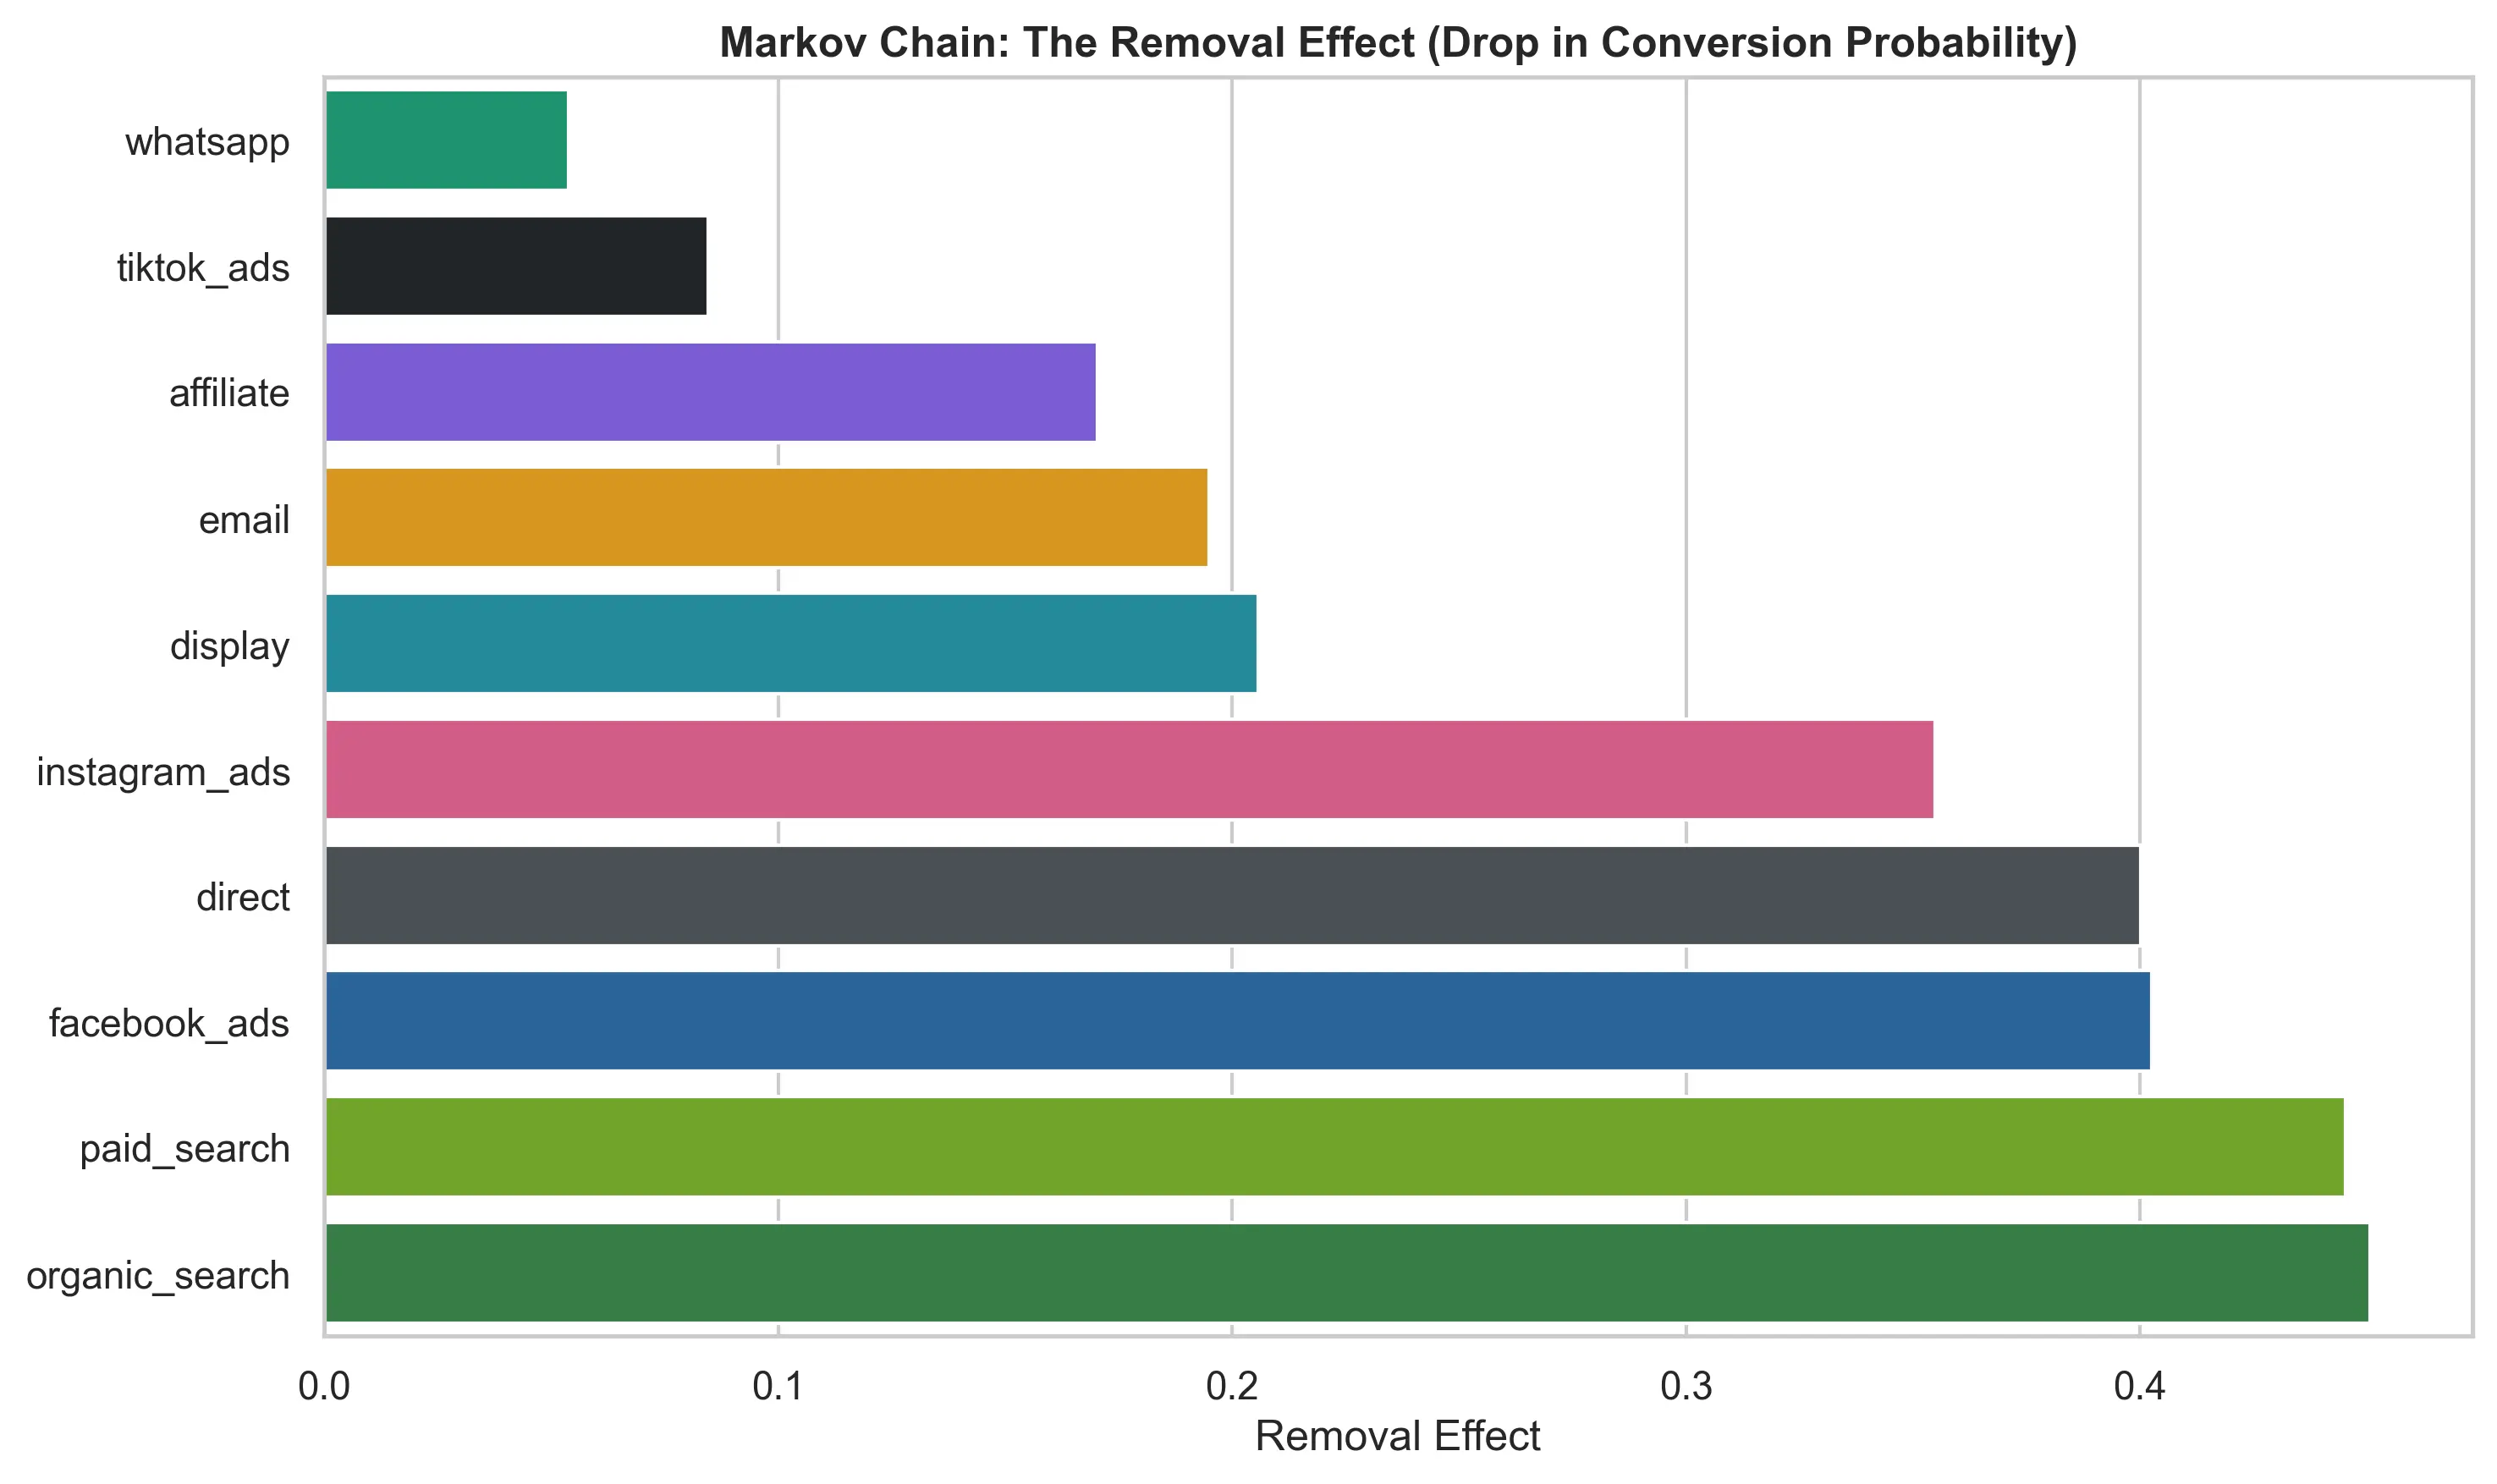
The key output is the Removal Effect: if I remove TikTok Ads from the network entirely, what percentage of total conversions collapses? The answer comes from observed data, not an assumed weight. Channels deeply embedded in successful paths make conversions collapse when removed. Channels that are easily bypassed barely move the number. The results are a direct product of the structure of the customer journeys.
Shapley Values come from cooperative game theory: each channel is a “player” in a coalition, and the algorithm calculates its marginal contribution to the shared outcome. Imagine every possible combination of channels working together to produce a conversion. A channel’s Shapley Value is its average marginal contribution across all those coalitions — what it adds when joining a group that didn’t have it. The math guarantees a fairness property: no channel is over- or under-credited relative to what it actually contributed. Unlike heuristics, Shapley doesn’t decide how much credit each channel deserves. The math derives it from every observed combination of customer journeys.
Both models are computationally heavier than heuristics, but they converge on the same structural finding: discovery channels — TikTok Ads and Organic Search — are systematically distorted by Last-Touch. The Markov Removal Effect shows that organic_search and paid_search have the two highest removal effects in the dataset — above 0.45 each — while TikTok, ignored by Last-Touch, shows a removal effect of ~0.08, more than double what its proportional credit would suggest. Last-Touch ignores both signals because it only looks at the final step.
This convergence built confidence. But neither model could see channel interactions — whether TikTok primes customers to convert via email, or whether specific channel sequences create non-linear effects invisible to statistics. That required machine learning.
Act 3: The Machine Found What the Math Missed
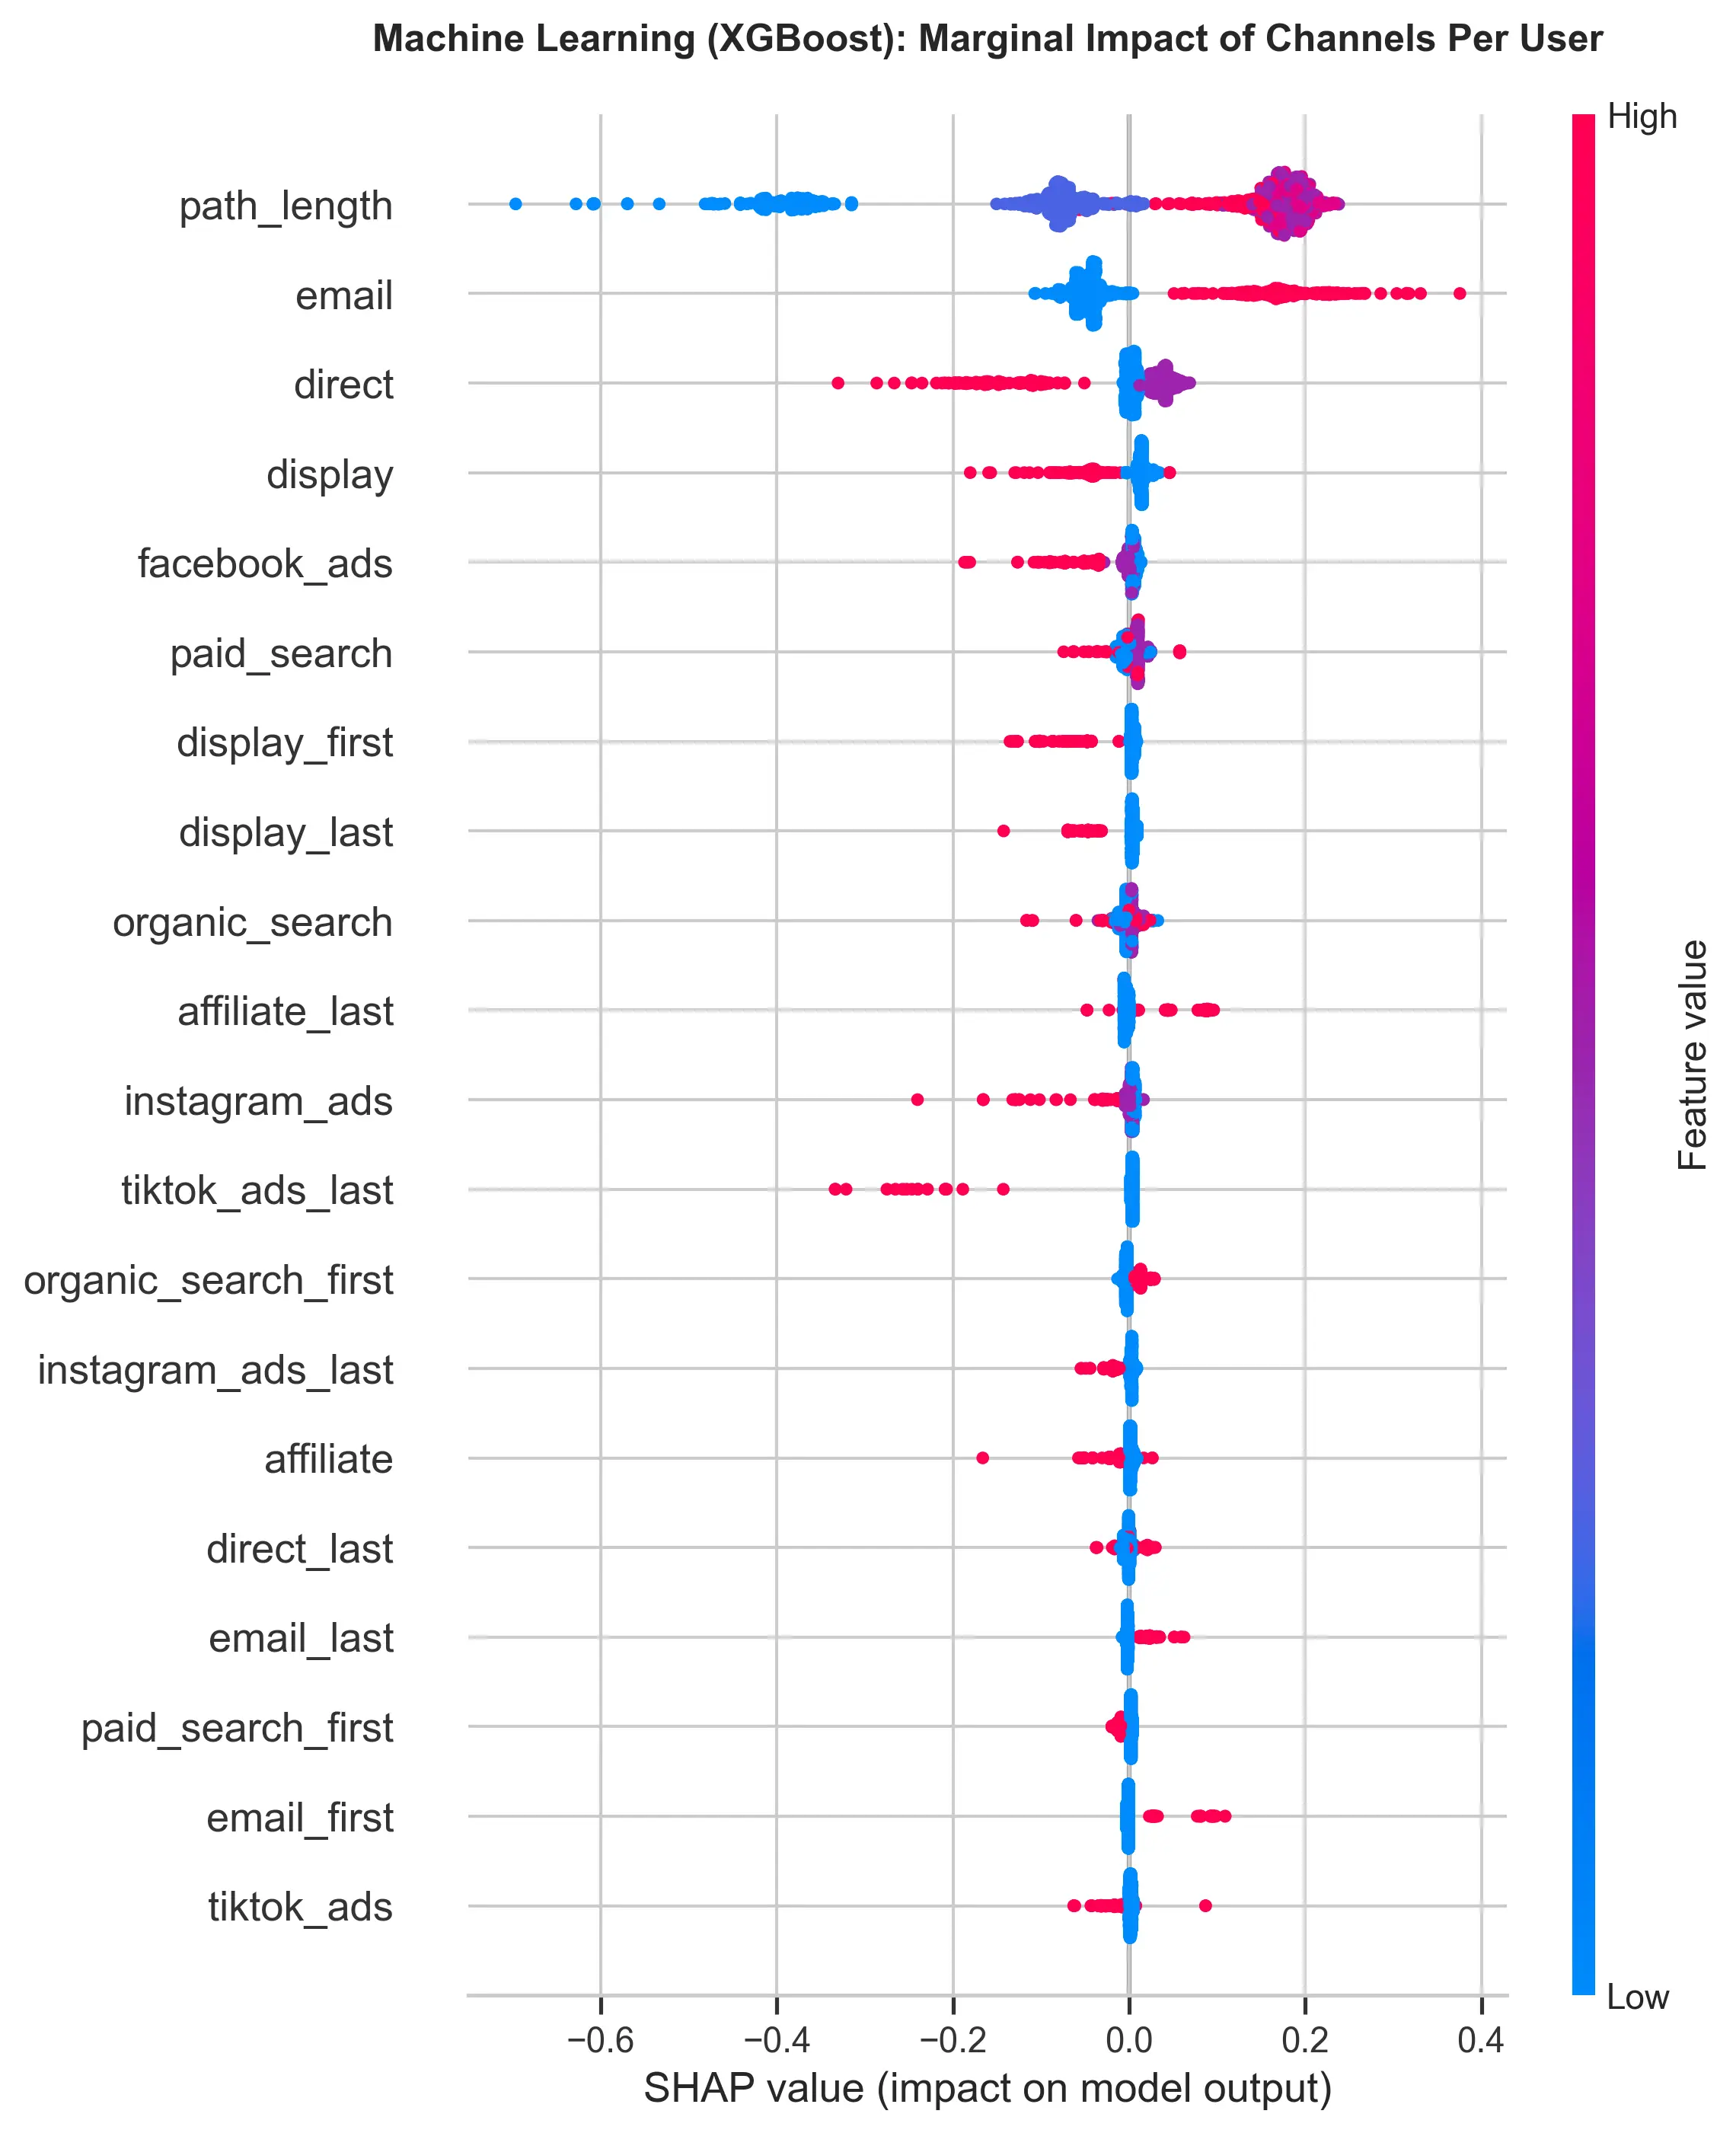
I trained an XGBoost model — a machine learning algorithm that builds decision trees to find non-linear patterns — on all the converted journeys in the dataset. The goal wasn’t to predict conversion; it was to understand which channel combinations drive it. XGBoost doesn’t assume a weight for TikTok or a weight for Email. It reads 35,000 journeys and learns which sequences, which combinations, and which orderings actually led to revenue.
To turn those learned patterns into per-channel attribution, I applied SHAP — a technique that makes ML model decisions interpretable by assigning revenue credit per channel per user. For each converted journey, SHAP asks: how much did each channel contribute to this specific conversion? Summed up, this data shows the impact of each channel, enabling the business to take concrete action.
The headline result: a 42.5% Attribution Error. Of the $509,237 in revenue, $216,317 was recorded in the wrong channels — credit taken from channels that actually build intent and handed to channels that show up at the right moment without having created it.
What Supports This Conclusion?
Email: +318% vs. Last-Touch. This is the most dramatic finding in the entire analysis. Last-Touch credits $47,216 to Email. The ML model credits $197,573 — a gap of $150,357. Why such a brutal distance? Last-Touch captures Email when it appears as the last click, but misses the case where it acts as a closing channel after a long chain of prior touchpoints. The ML model detected a non-linear pattern: Email sent to someone who already discovered the brand through Organic Search or TikTok generates a disproportionate lift. Cold email converts poorly. Email sent at the right moment, to an already-warmed audience, closes cycles. Last-Touch only sees the second case — and even then distorts the magnitude.
TikTok Ads: +440% vs. Last-Touch. Last-Touch credits just $3,839 to TikTok — the lowest figure of any channel, equivalent to 0.75% of total revenue. The ML model credits $20,743. Customers rarely convert on the first visit from a TikTok ad. They discover the brand, leave, and return days later via direct or organic search — where Last-Touch gives all the credit. The model saw the complete chain. TikTok isn’t failing to close deals; it’s the reason the deals started in the first place.
Display Ads: +161% vs. Last-Touch. This is the most counterintuitive result — and perhaps the most important one for revising assumptions. Last-Touch credits $30,402 to Display. The ML model credits $79,459. This inverts the conventional narrative that “Display is over-credited.” What the data suggests is different: Display acts as a presence channel throughout complex journeys, appearing at multiple points before conversion. Last-Touch captures only the last of those points and, when Display isn’t the final click, ignores all its prior presence. Survival Analysis (Act 4) will calibrate this role more precisely — because being present is not the same as accelerating the decision.
Facebook Ads: -65% and Instagram Ads: -60% vs. Last-Touch. Together, these two channels collect $130,354 from Last-Touch. The ML attributes only $48,448 — a gap of $81,906 in unearned credit. The pattern is consistent: both channels reach users in the final hours before a purchase that was already going to happen. Last-Touch rewards them with full credit for being present. The model saw what actually happened — these channels weren’t creating intent, they were showing up in front of it.
Organic Search: -70% vs. Last-Touch. This is the hardest finding to digest for any manager who has invested in SEO. Last-Touch credits $83,751 to Organic Search — the second highest figure. The ML credits just $25,371. The explanation isn’t that SEO doesn’t work; it’s that Last-Touch over-credits SEO because many journeys end with a branded organic search — a search the customer would have done regardless of any other channel. The Markov model confirms: the organic_search removal effect is high because it’s present in many journeys, not necessarily because it initiates or accelerates them.
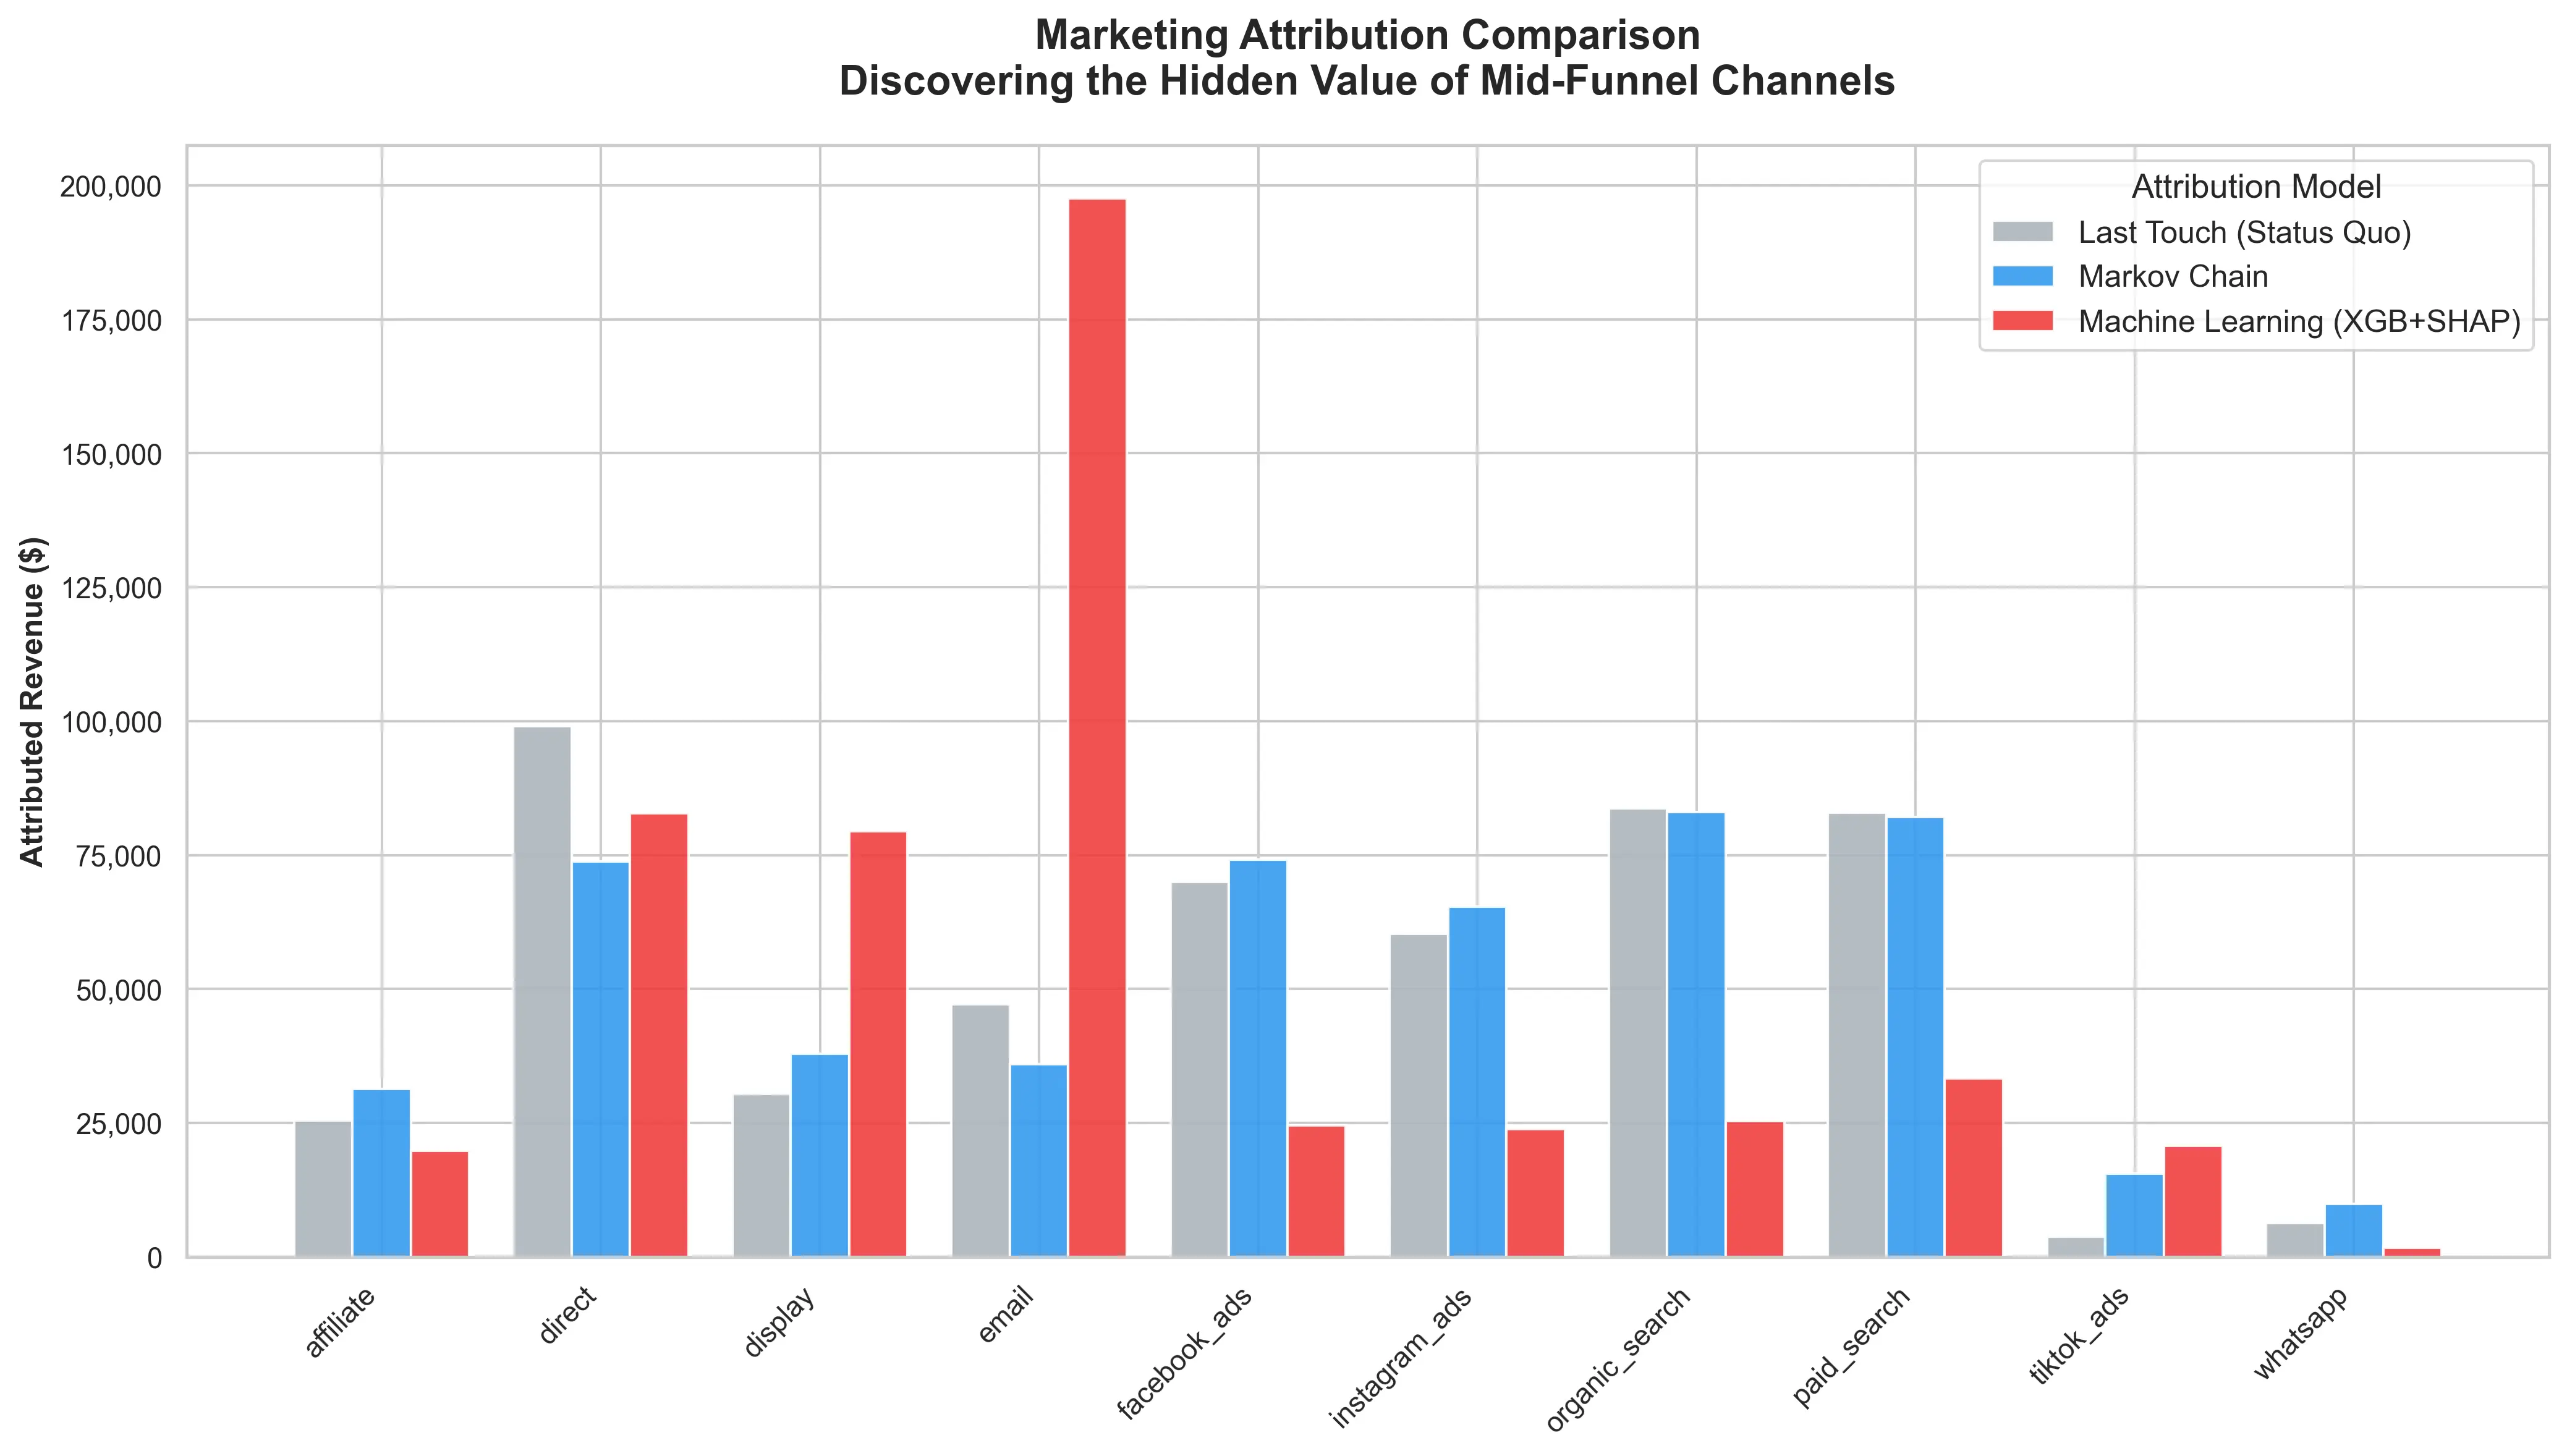 Revenue attribution across models. The gap between Last-Touch (grey) and ML/XGBoost (red) represents misallocated budget.
The Concrete Cost of Doing Nothing
The chart below translates the divergence into direct business language: how much revenue is being rerouted when you replace Last-Touch with ML.
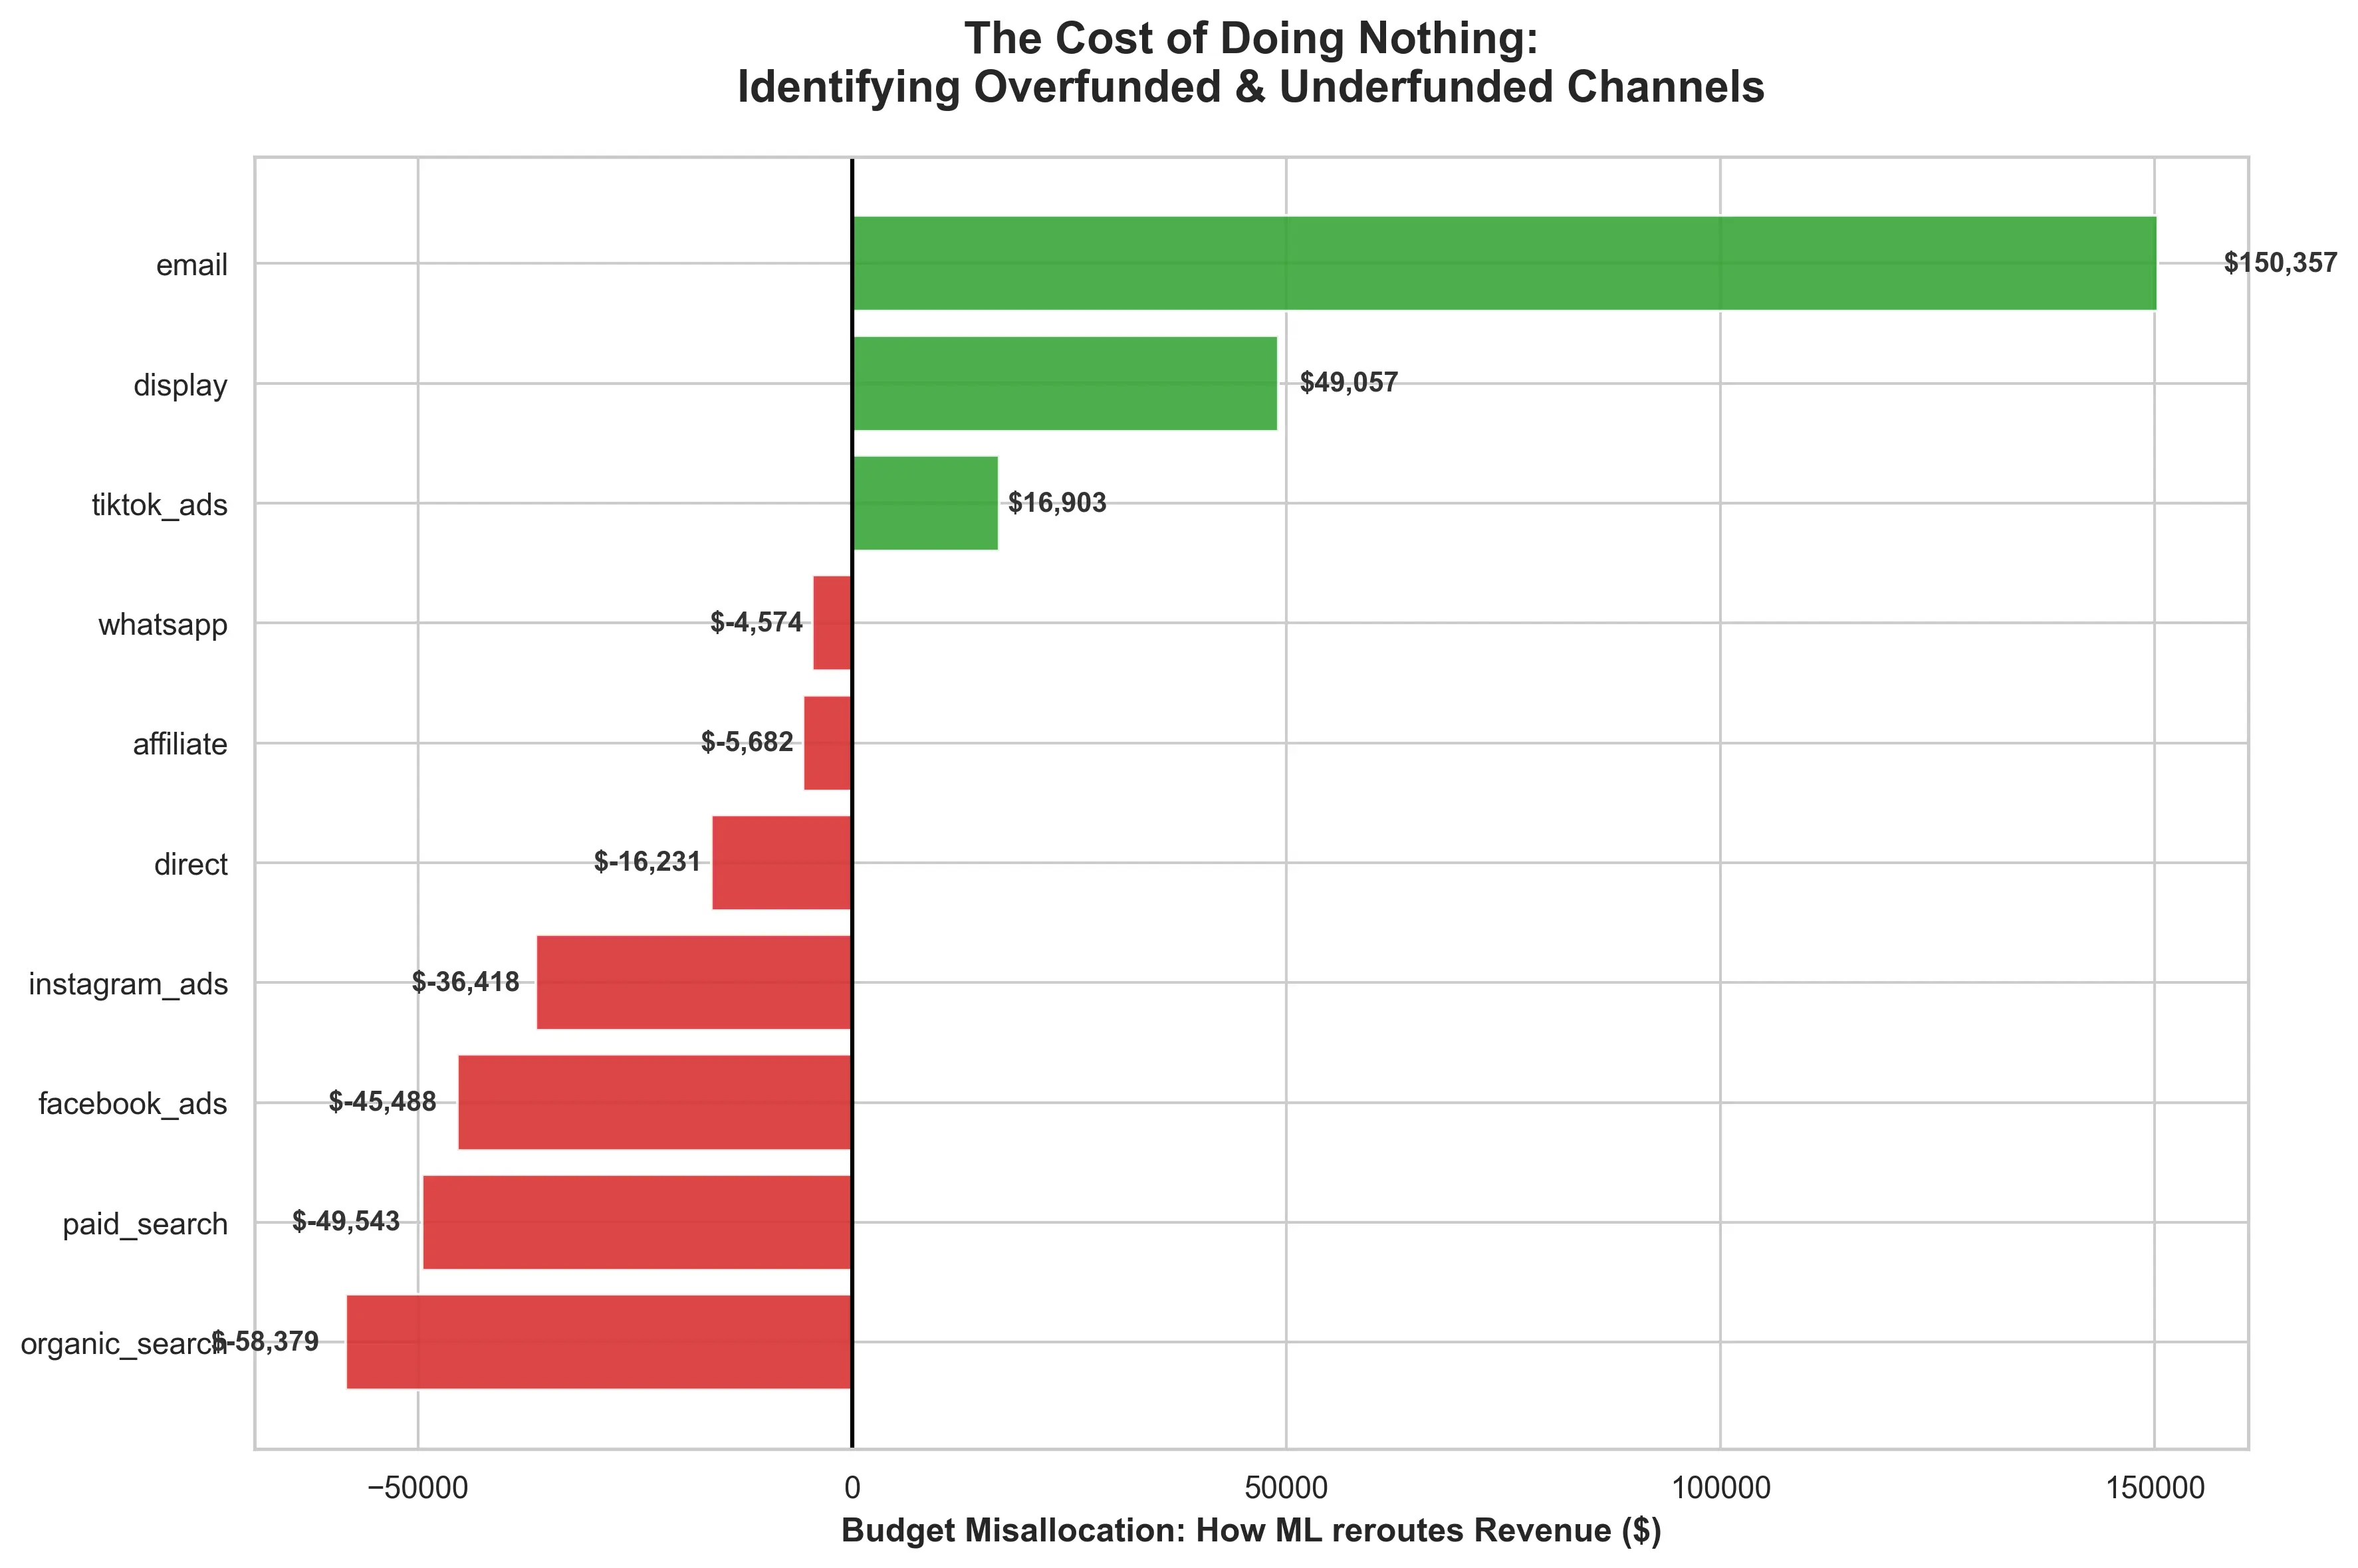
The numbers don’t need interpretation — they speak for themselves:
- Email: $150,357 under-credited. The most effective channel in the mix was receiving less than a quarter of the credit it deserved.
- Display: $49,057 under-credited. Present in complex journeys, invisible to Last-Touch whenever it doesn’t close the cycle.
- TikTok Ads: $16,903 under-credited. Nearly five times more real impact than the dashboard showed.
- Organic Search: -$58,379 over-credited. Excess credit for harvesting intent already created by other channels.
- Paid Search: -$49,543 over-credited. The same pattern: present at the end of the journey, but not necessarily the engine of it.
- Facebook Ads: -$45,488 over-credited. Retargeting collecting credit for conversions that were already on their way.
The misallocation index answers which channels are under- or over-credited — and by how much. But for a business managing cash flow and CAC payback windows, there’s a second question attribution models can’t answer on their own: when do customers actually convert?
Act 4: Knowing “When” Is Just as Important as Knowing “If”
Standard machine learning treats a buyer who converts in 2 days identically to one who converts in 20 days. Both are labeled “converted.” Both count equally. For a business managing CAC payback periods, that’s a costly abstraction — a channel that reliably closes customers within 48 hours has a fundamentally different cash flow profile than one that seeds demand that pays off three weeks later.
To answer the timing question, I applied a separate analytical layer: Survival Analysis — a technique from clinical biology that models time-to-event, originally used to predict patient survival, here adapted to predict time-to-conversion.
The key shift in framing is in the question it asks. Attribution models ask: will this user convert? Survival Analysis asks: how fast will this channel push them to convert?
One methodological detail makes this work correctly: right-censored data. Users who haven’t converted yet are not failures — standard ML discards them as non-converters and biases all timing estimators downward; Survival Analysis keeps them in the dataset correctly.
The output is Hazard Ratios — a multiplier expressing each channel’s effect on conversion speed relative to a baseline. A ratio of 1.14 means 14% faster than baseline. A ratio below 1.0 means the channel is systematically extending the time to conversion.
The channels split into two distinct groups.
Accelerators are channels with Hazard Ratios above 1.0 — they compress the path to purchase. Email is the clearest example: a Hazard Ratio of 1.14 means customers touched by Email convert 14% faster than baseline. This is consistent with the XGBoost finding — Email isn’t just influential in terms of attributed revenue, it’s urgent. When it fires on an already-warmed lead, it closes cycles quickly. Paid Search (HR ~1.07) and Organic Search (HR ~1.06) also accelerate conversion — which adds a layer of nuance to the over-crediting finding from Act 3: these channels are genuinely effective at closing journeys, but Last-Touch credits them for entire journeys they only finished.
Decelerators are channels with Hazard Ratios below 1.0. Display Ads is the most revealing case when combined with Act 3. The ML model showed Display is under-credited in terms of attributed revenue — it appears in more journeys than Last-Touch acknowledges. But Survival Analysis shows it’s the only channel with an HR below 1.0, systematically extending the time to conversion. These two findings together build a precise portrait: Display has real presence in journeys, but functions as a slow re-engagement channel — it amplifies consideration without creating urgency. Investing more in it because the ML under-credited it would be a mistake; the right move is investing in it with correct expectations about what it actually does.

The business implication is direct. If you need cash this week — if you’re managing a tight CAC payback window — weight the mix toward Accelerators. Channels with high Hazard Ratios compress the gap between spend and revenue. If the goal is pipeline for next quarter, invest in discovery channels with lower Hazard Ratios. TikTok’s role is to introduce the brand to audiences who will eventually convert; forcing it to compete on closing speed is a misunderstanding of what it does.
Survival Analysis doesn’t replace the attribution layer — it extends it. Act 3 answered how much credit each channel deserves. Act 4 answers when that credit arrives. Together, the two layers offer a complete view of channel economics: both the magnitude and the timing of returns.
Stop Guessing. Start Calculating.
The $216,317 in misallocation this analysis found is not a one-time anomaly. That figure compounds across every budget cycle that uses Last-Touch as the source of truth. Three decisions change it:
Reallocate budget from over-credited channels to under-credited ones. Facebook Ads and Instagram Ads are collectively collecting $81,906 in credit for intent they didn’t create. Organic Search and Paid Search absorb another $107,922 in credit for closing journeys that other channels built. The budget flowing to them is coming directly out of Email and TikTok — the channels that actually create and amplify that intent. Fix the attribution, fix the allocation.
Use Survival Analysis to match the channel mix to cash flow timing. If the business is in a short CAC payback cycle — managing runway, hitting a quarterly target — weight the mix toward Accelerators. Email with a Hazard Ratio of 1.14 closes faster. If the goal is pipeline for next quarter, invest in discovery spend that seeds demand even if it doesn’t close this week.
Treat Email as a multiplier, not a standalone channel. The XGBoost model found that Email’s value is almost entirely conditional on prior brand exposure. Cold email converts poorly. Email sent to an audience that already found the brand through TikTok or Organic Search triggers a non-linear lift — and the data shows that lift is worth $150,357 more than Last-Touch was seeing. The right strategy isn’t more cold lists — it’s pairing Email investment with top-of-funnel discovery spend so the multiplier effect has something to amplify.
The full pipeline — Markov Chains, Shapley Values, XGBoost, and Survival Analysis — is available here: GitHub Repository
When we find data that allows us to evaluate with clarity, we stop guessing and start investing correctly. The return on marketing investment is the direct consequence of this type of data-driven strategic decision.