You’ve probably heard the story: in tough times, lipstick sales soar. It’s the “affordable little luxury” that withstands the economic apocalypse. A narrative so good, so elegant, that we almost want it to be true.
But… what if the most told story in marketing hallways is just that: a story?
I decided to put this theory to the test. Not with guesswork or a single year of data, but with 216 months of information, two of the century’s biggest economic crises, and a pandemic in between. The result not only debunks the myth but reveals a much more interesting and strategic consumer behavior.
Let’s dive in.
What is the “Lipstick Effect” and why is it so seductive?
It all started with Leonard Lauder, heir to the Estée Lauder empire, who noticed a curious phenomenon after the 9/11 attacks: while the luxury market plummeted, his company’s lipstick sales grew.
The psychological explanation is a true marketing masterpiece: when the landscape prevents us from fulfilling big desires (like a new handbag), we compensate with small pleasures. In this case, lipstick would be the perfect “affordable indulgence.” It’s a theory with a name, a story, and a powerful emotional appeal.
The problem? The prettier the story, the more we forget to test it. And that’s exactly what I did.
The methodology: 216 months under the microscope
To separate myth from data, I built a robust longitudinal panel. It comprises 18 years of monthly information, from January 2008 to December 2025, taking us through two complete recession cycles.
I used:
- Search Interest: Google Trends for “Lipstick” (affordable luxury) and “Louis Vuitton” (premium luxury).
- Economic Indicators: Unemployment rate, personal consumption expenditures (PCE), and personal care retail sales (data from the Federal Reserve).
- Financial Market: Performance of Estée Lauder stocks compared to the S&P 500.
Why start in 2008? Simple: the Great Recession is the perfect laboratory. Unemployment skyrocketed from 5% to 10% in two years, without the “confounding” factors of a pandemic. If the effect were a universal law, that’s when it should have shined.
2008: The Crucial Test the Myth Failed
Here’s the first chart, telling the main story.
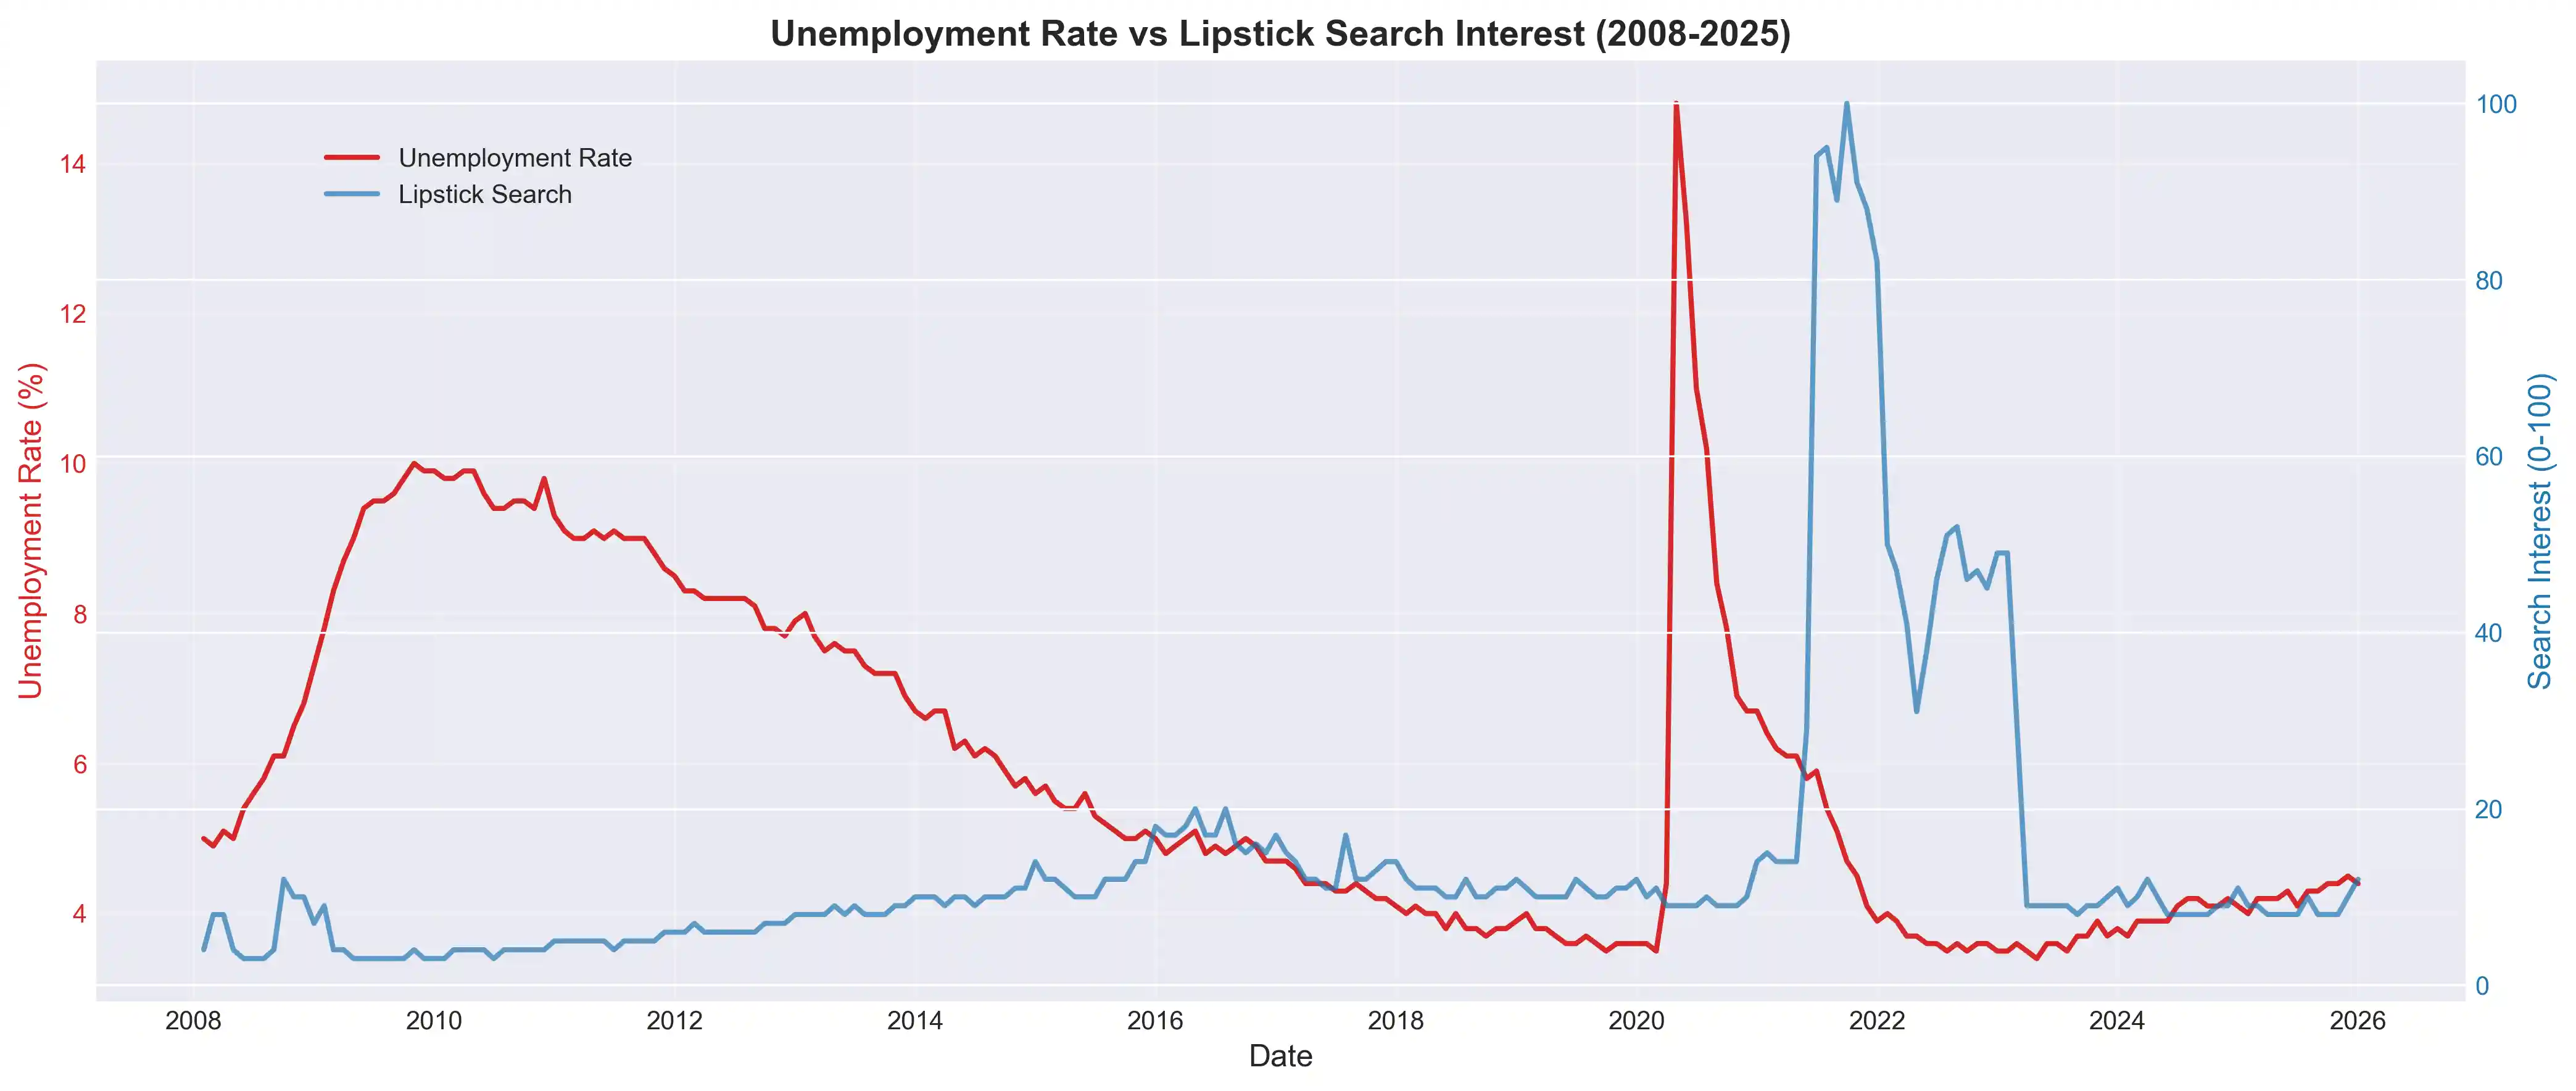
Look at the period from 2008 to 2010. With unemployment soaring, reaching 10%, interest in lipstick remains… absolutely flat. No peak, no acceleration, nothing. The effect, which should have been the star of the show, simply doesn’t appear.
Now, notice 2021. Interest explodes, reaching its all-time high. But unemployment was already in free fall. This peak isn’t a recession phenomenon; it’s a reopening phenomenon. The masks came off, and lipstick became practical again.
Immediate conclusion: The Great Recession was the definitive test, and the Lipstick Effect failed.
The historical series: when does lipstick actually grow?
Broadening our view makes the disconnect between narrative and reality even clearer.

From 2008 to 2020, the lipstick and luxury curves move together, at a low and stable level. They don’t stand out in crises, nor does luxury suffer sharp declines. Both behave like goods that grow with prosperity, not against it.
The 2021 peak, which once seemed to confirm the effect, now reveals itself as a unique, isolated event: the explosion of pent-up demand from mask-wearing.
Dispersion and correlation: the math debunks the myth
For those still in doubt, the statistics are relentless.
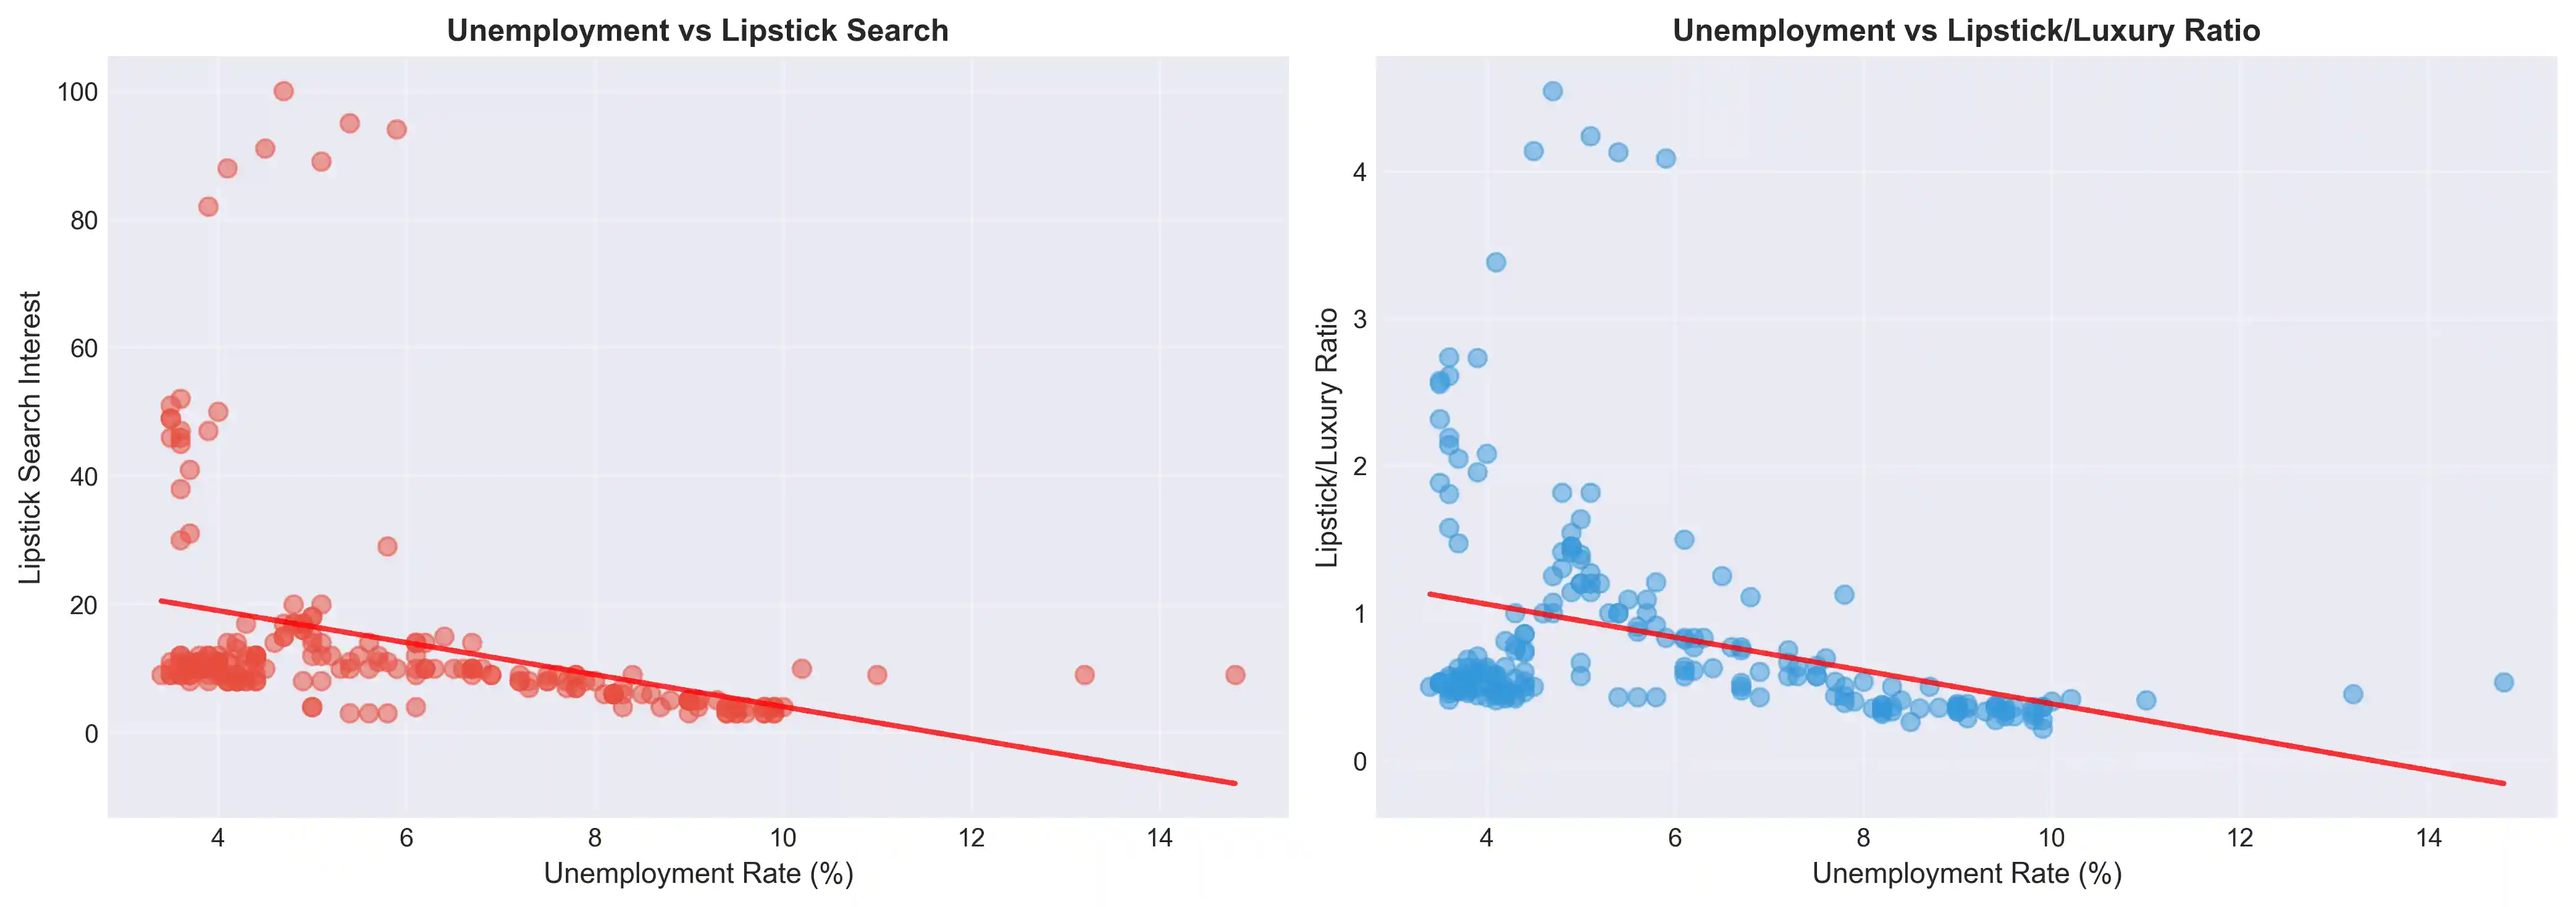
With 204 data points, the scatter plot shows that the highest peaks of interest in lipstick occur exclusively in periods of low unemployment (between 3% and 6%). When unemployment rises (8% to 10%), interest plummets.
The correlation matrix confirms the verdict: the relationship between unemployment and interest in lipstick is negative at -0.348. In other words, when one goes up, the other goes down. It’s the opposite of what the myth preaches.
And no, the effect isn’t delayed. We tested correlations with lags of 1 to 6 months, and the result was always the same: negative.
The “Mascara Effect”: The Most Sophisticated Discovery
But it’s not all about debunking. The data revealed something far richer than the simplistic lipstick myth: a psychological mechanism of hedonic compensation that is contextual.
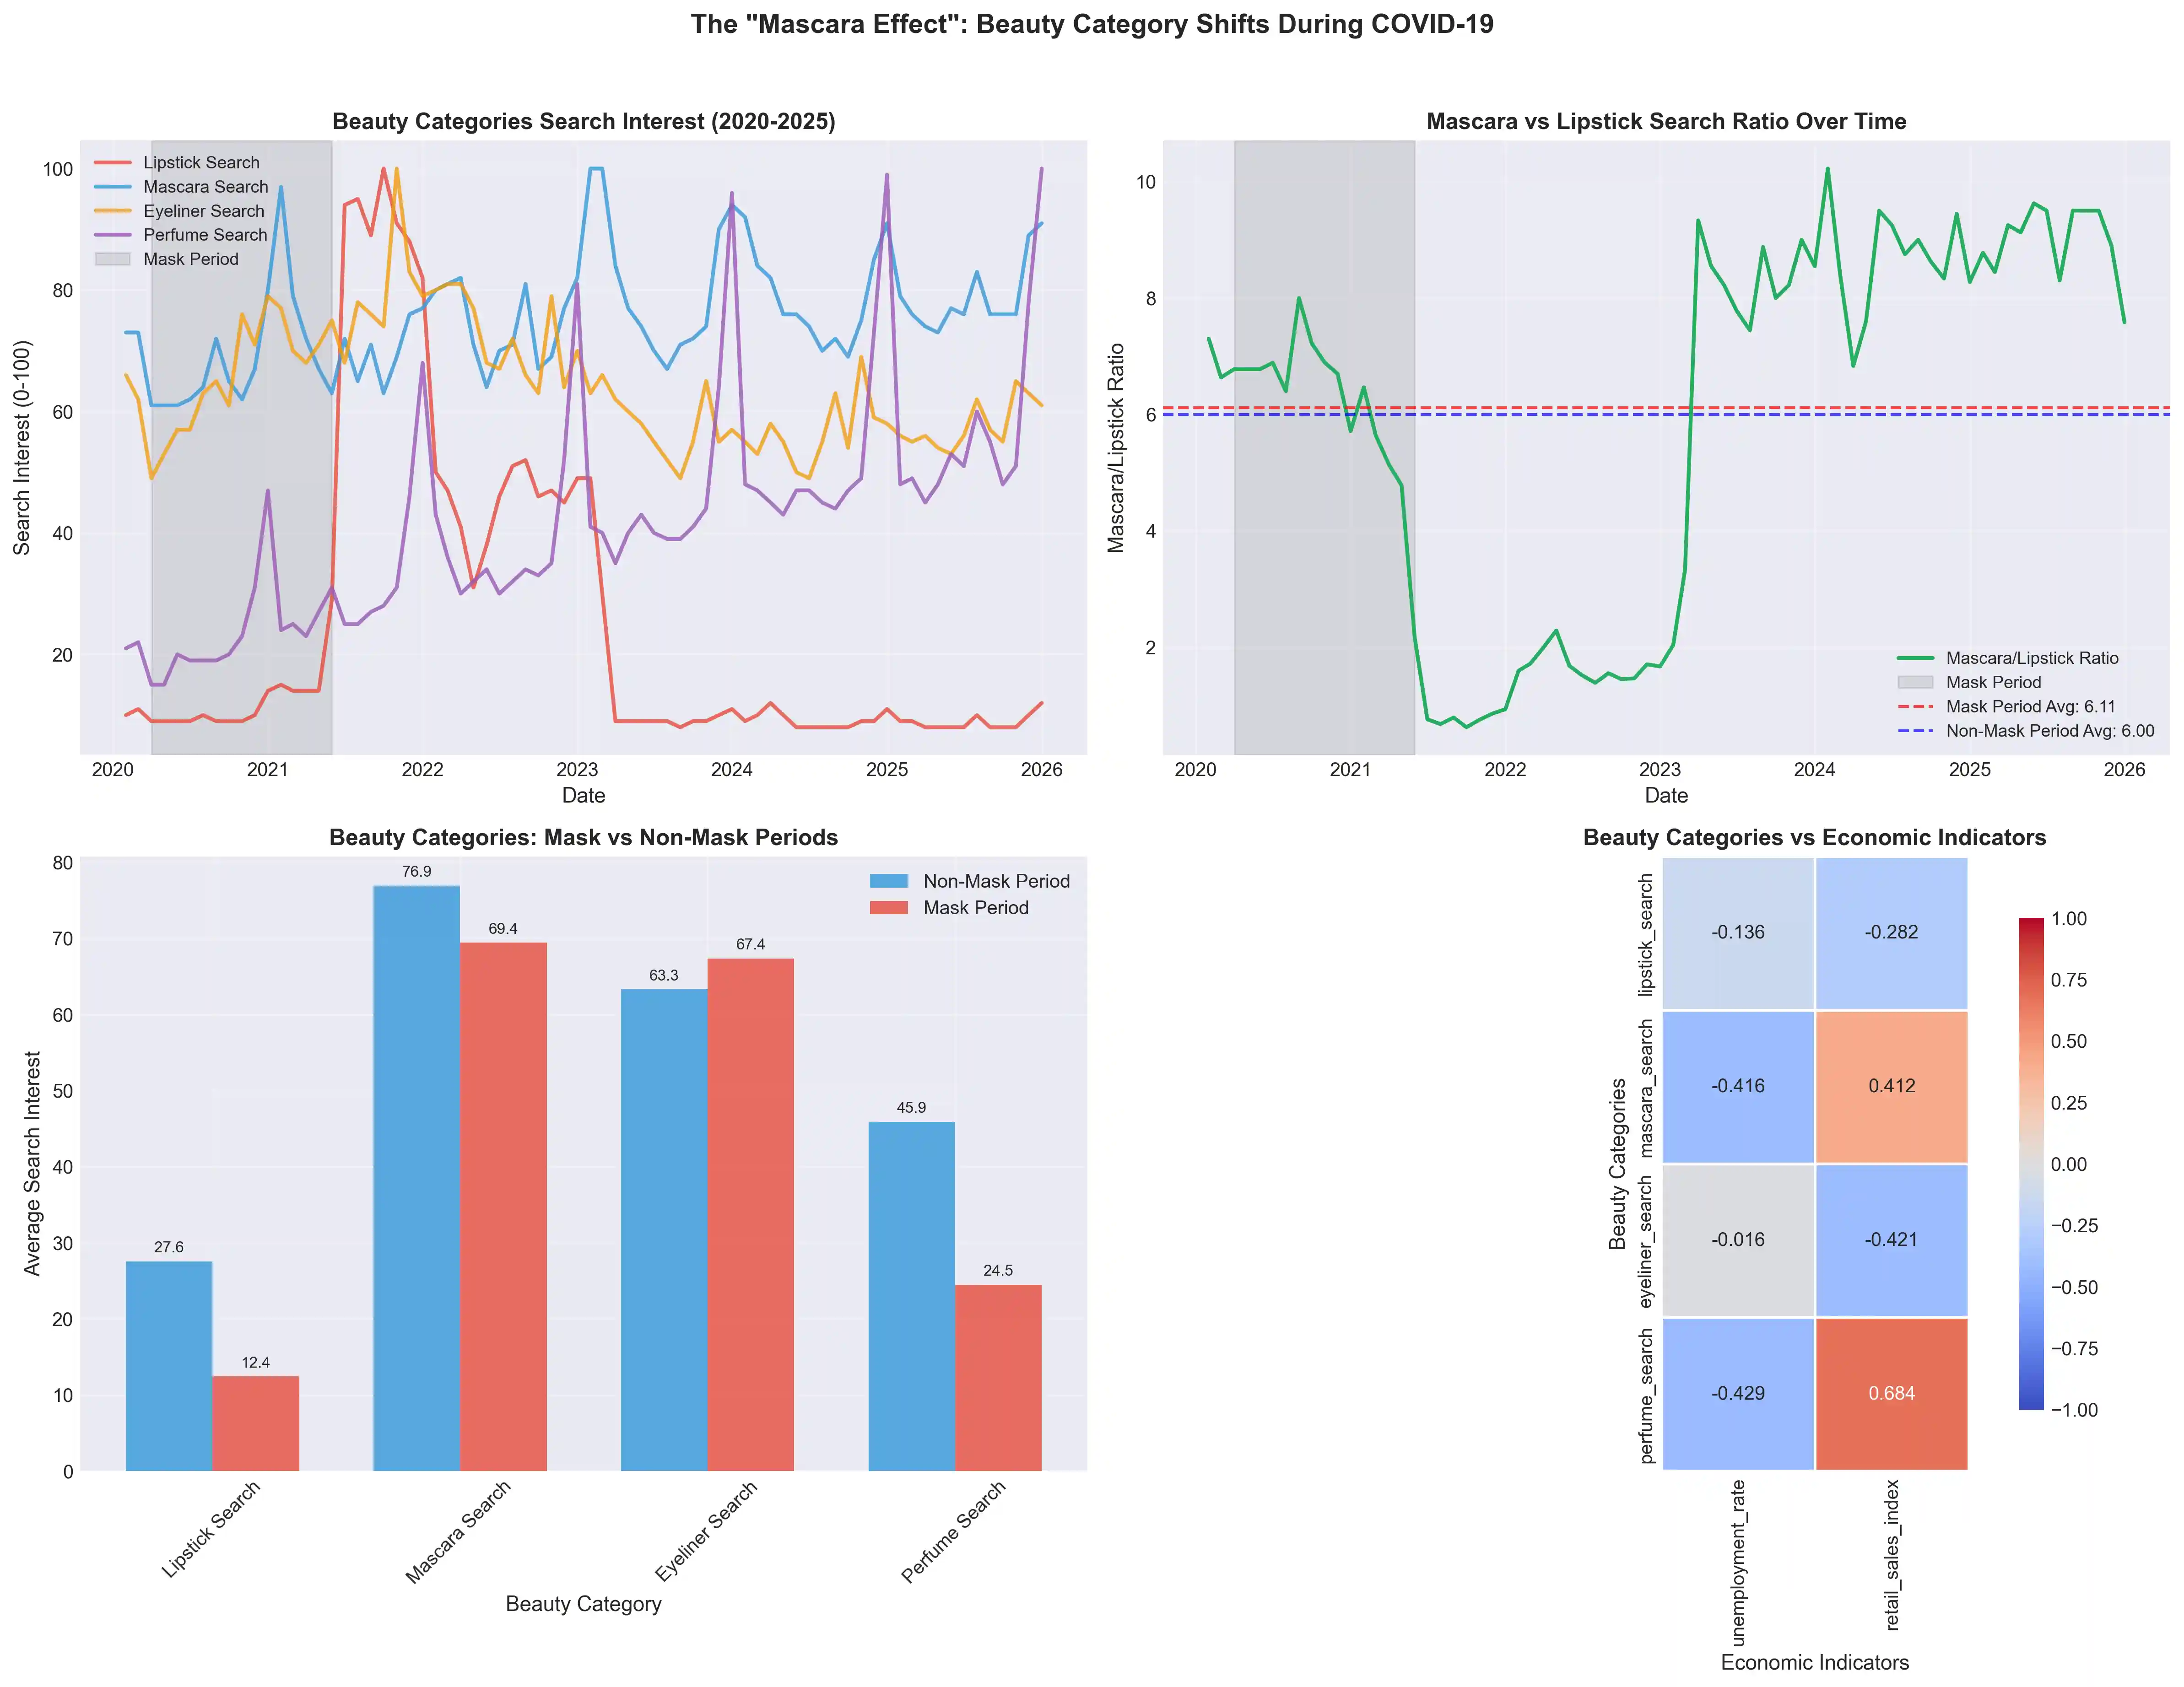
During the mandatory mask period (the gray area in the chart), interest in lipstick dropped by 16%. However, interest in mascara skyrocketed. Why? Because eyes were on display, and the need to feel good was reallocated to where it was visible.
The consumer didn’t abandon the small luxury; they reallocated it.
This is the strategic insight. A company that bet on lipstick in 2020 based on the “Lipstick Effect” made the wrong decision. One that bet on mascara or skincare made the right call.
Retail grows, but it’s a different story
Personal care sales have grown consistently for 17 years, as the chart below shows. But this is a story of secular resilience, not counter-cyclicality.
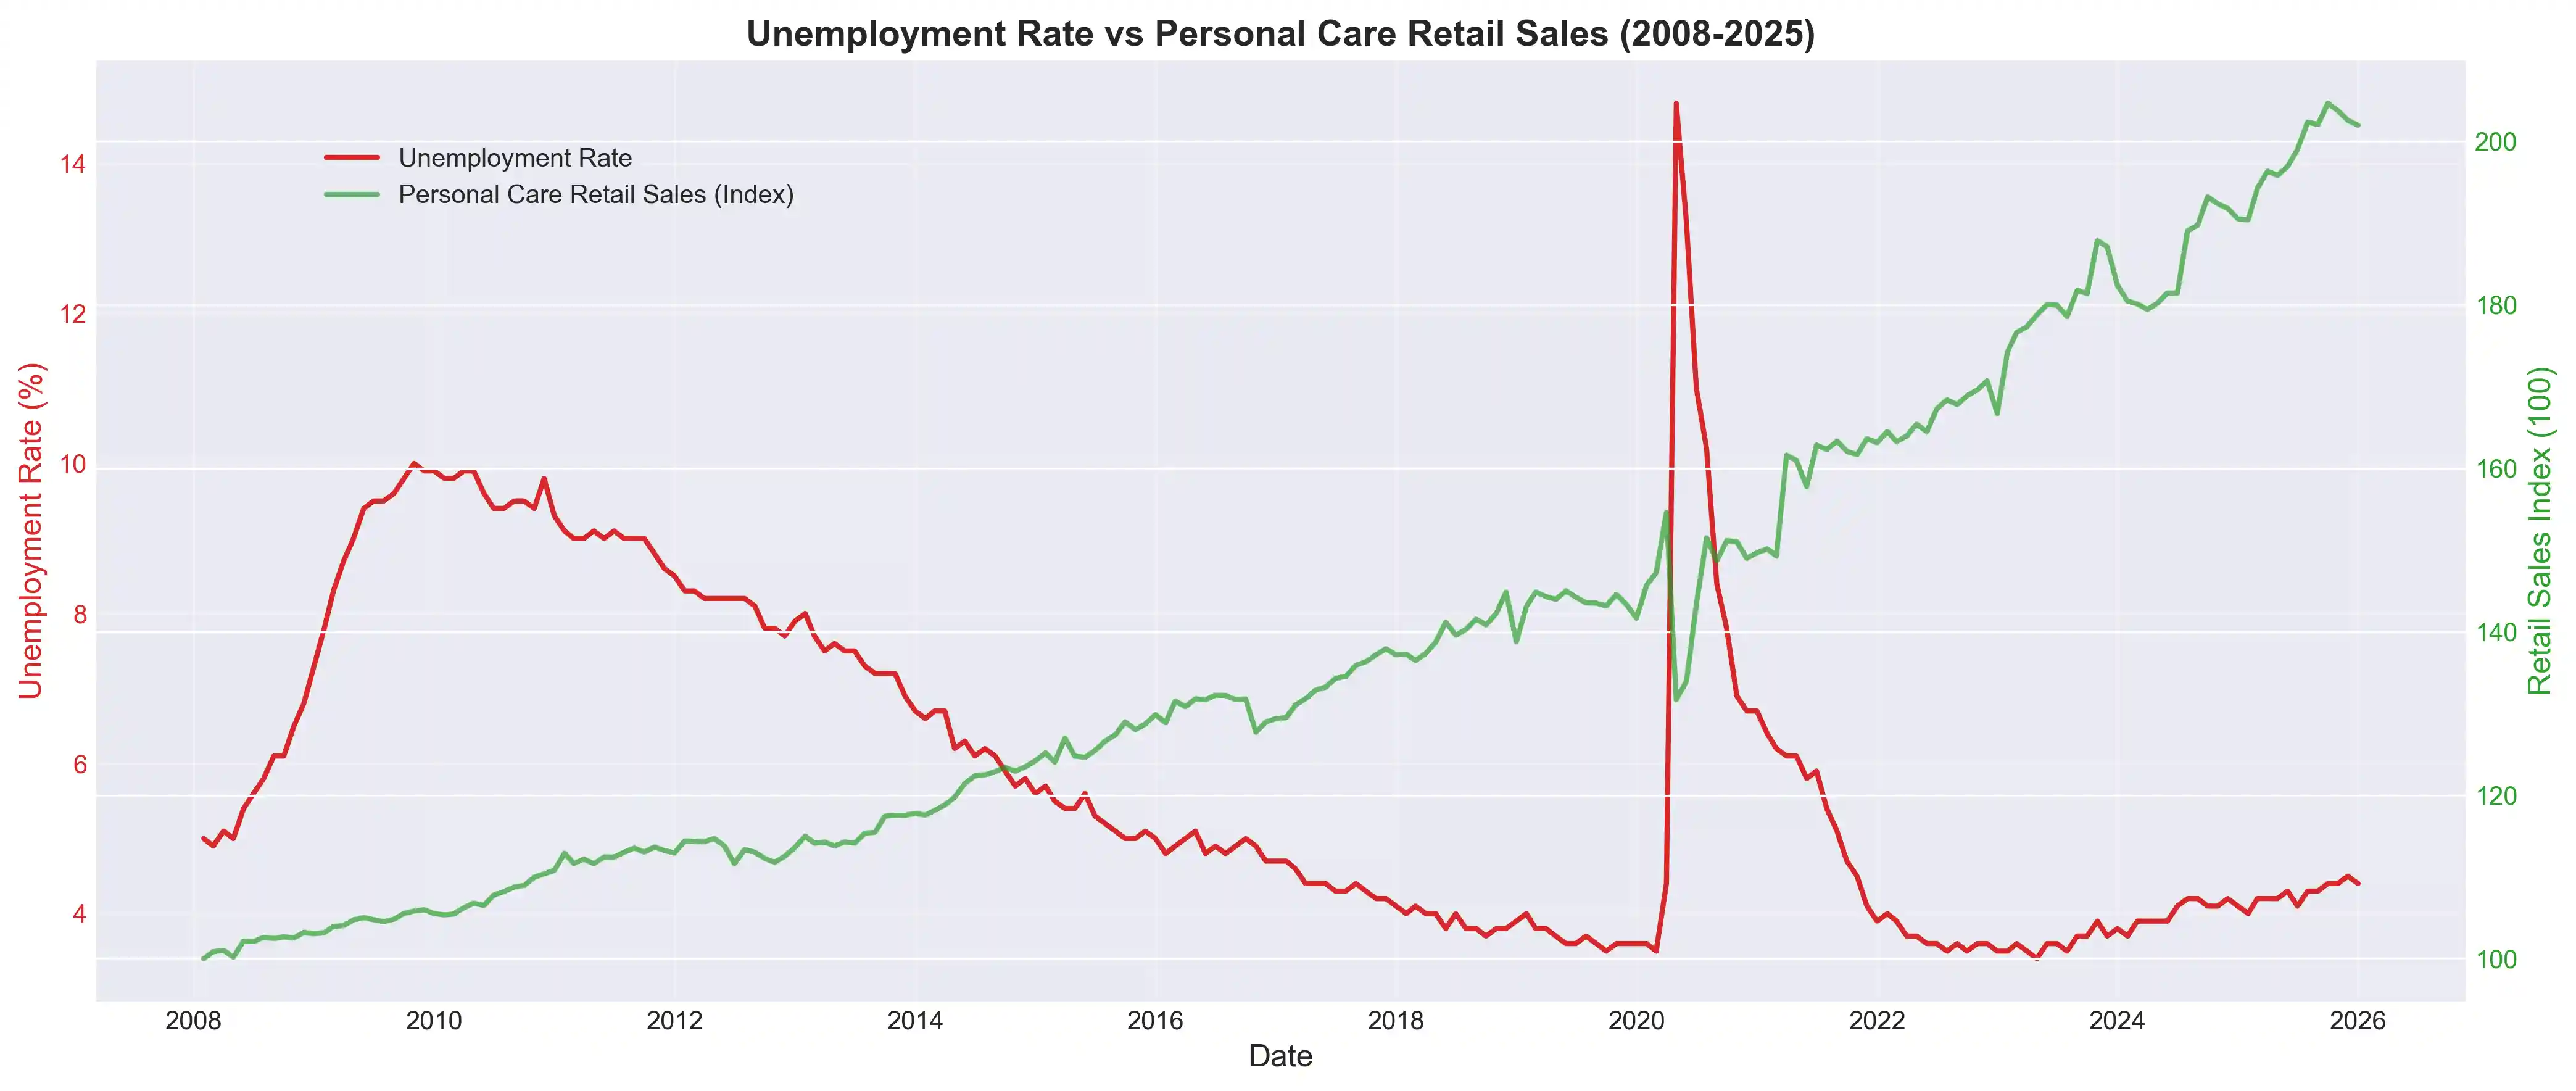
The sector doesn’t collapse in crises, but it also doesn’t accelerate because of them. It simply follows its structural growth trend, driven by demographic and cultural factors. Surviving a crisis is not the same as benefiting from it. And confusing these two things can be costly.
The Estée Lauder case: a rollercoaster of emotions
And finally, the data point that should make any investor rethink their beliefs: Estée Lauder’s stock.
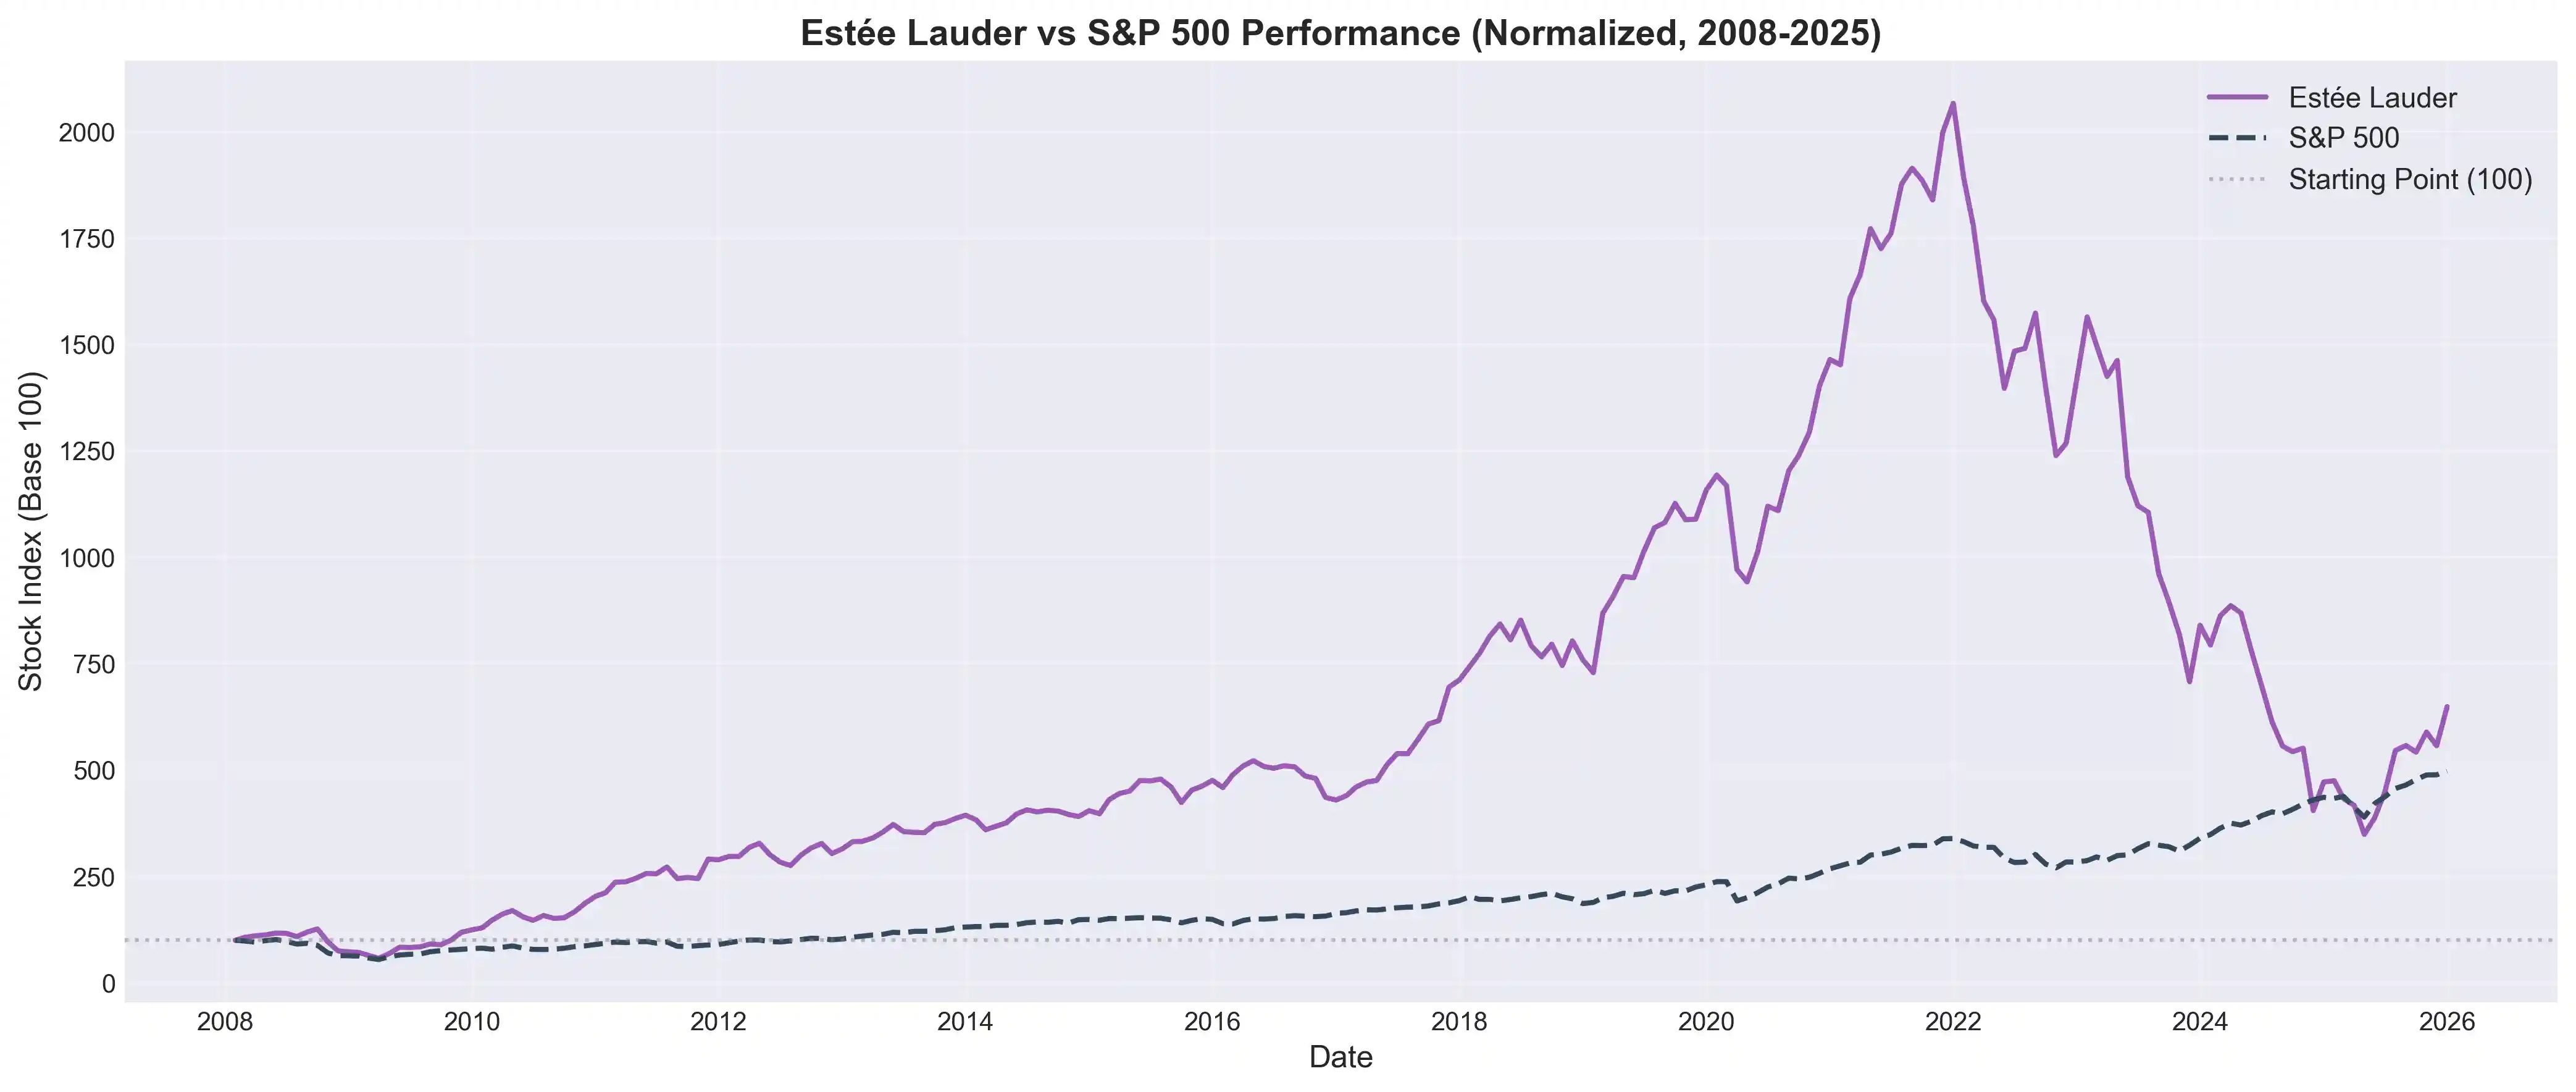
Between 2008 and 2022, the company saw a valuation increase of nearly 2,000% compared to the S&P 500’s 350%. A monstrous performance. But timing is crucial: during the 2008 crisis, it fell along with the market. Its boom came with the global economic recovery and, mainly, with its expansion in Asia.
The lesson is even stronger with the recent collapse: from 2022 to 2024, the stock plummeted 77%, while the S&P rose 30%. The company that “should” have been a safe haven showed that its growth drivers were specific and fragile, tied to the Chinese market and premium luxury, not the mythical power of lipstick in crises.
What have we learned? (And what does this mean for you?)
After 18 years of data, the verdict is clear:
- The “Lipstick Effect” is not a consumer law. Greater economic adversity is associated with lower interest in affordable cosmetics, not higher.
- Resilience is not counter-cyclicality. The personal care sector is structurally resilient but does not benefit from crises. It grows with prosperity.
- Context is everything. The “Mascara Effect” proves that hedonic compensation exists, but the product that enables it depends on usage behavior in each scenario.
Practical implications for your strategy
If you make marketing or product decisions, take these three lessons away:
- Demand Planning: In a recession, don’t assume your beauty products will be automatically protected. Adjust inventory and targets for a retraction scenario, not a flight to consumption.
- Brand Positioning: The promise of the “small pleasure that withstands the crisis” is fragile. A positioning based on “investment in well-being that grows with you” is much more aligned with reality.
- Investment: Cosmetics companies are not safe havens in crises. Their extraordinary performance comes from real market growth and innovation, not from supposed behavioral effects. Analyze the fundamentals, not the narratives.
METHODOLOGICAL NOTE
Data were collected via the Federal Reserve (FRED), Google Trends (pytrends), and Yahoo Finance (yfinance) APIs, covering the period from January 2008 to December 2024 (204 monthly observations). Stock series were normalized to a base of 100 in January 2008. Correlations were calculated using Pearson’s coefficient; lags of 0 to 6 months were tested to capture delayed effects. The mask period was defined as April/2020 to May/2021. All charts are direct reproductions of the analysis outputs. The complete code and raw data are available for replication.
Enjoyed this analysis? Subscribe to the newsletter to receive new studies on strategy, data, and consumer behavior straight to your inbox.