TL;DR
Most managers use their analytics tool’s default attribution model without ever questioning it. But there is no one-size-fits-all model — the right choice depends on sales cycle length, ticket size, channel mix, and data maturity. First-touch, last-touch, and fixed-weight multi-touch models all carry serious blind spots. Algorithmic approaches like Shapley Value and Markov Chain are more honest — but require meaningful data volume. The practical path is to run two or three models in parallel, compare the decisions each would drive, and pressure-test against field intuition. Like Goldilocks: there is no universally right bed. There is the right bed for your business — and you only find it by testing.
“Essentially, all models are wrong, but some are useful.” — George Box
Once upon a time, a golden-haired girl entered the house of three bears. She tried Papa Bear’s porridge — too hot. Mama Bear’s — too cold. Baby Bear’s — just right. She did the same with the chairs. And with the beds. She found what she was looking for, fell fast asleep — and ran away when the bears came home.
The end.
Or almost.
Because if you work in digital marketing and deal with campaign data, you just read a perfect allegory for one of the most persistent problems in the field: how do you assign credit to the channels that actually contributed to a conversion?
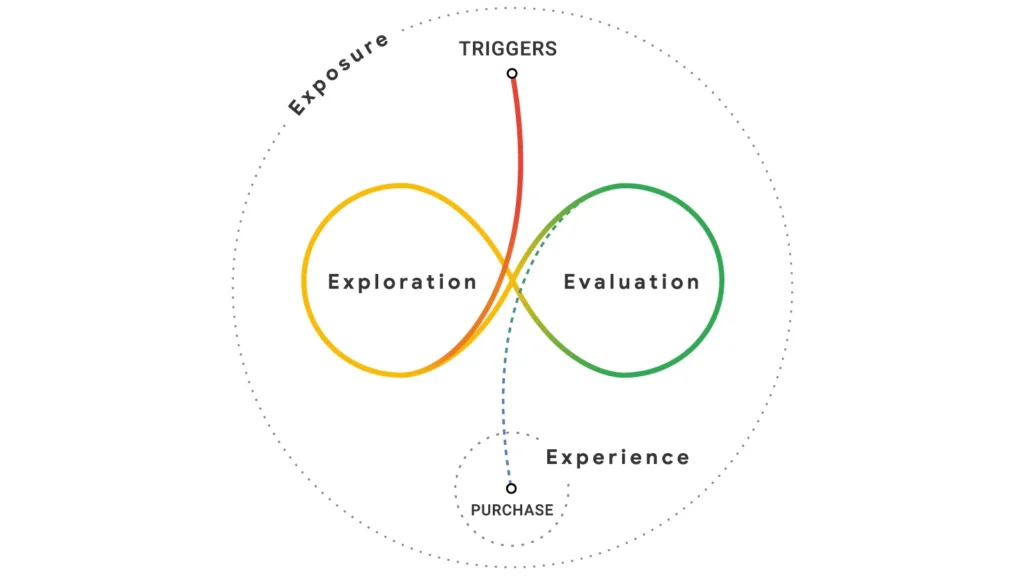
Goldilocks’ journey, after all, was not straightforward. She didn’t walk through the door and immediately lie down in the right bed. She moved through the house. She tested. She got it wrong. She adjusted. Only then did she arrive at a result. That is exactly what a real customer does before buying — and it is exactly what most attribution models go out of their way to ignore.
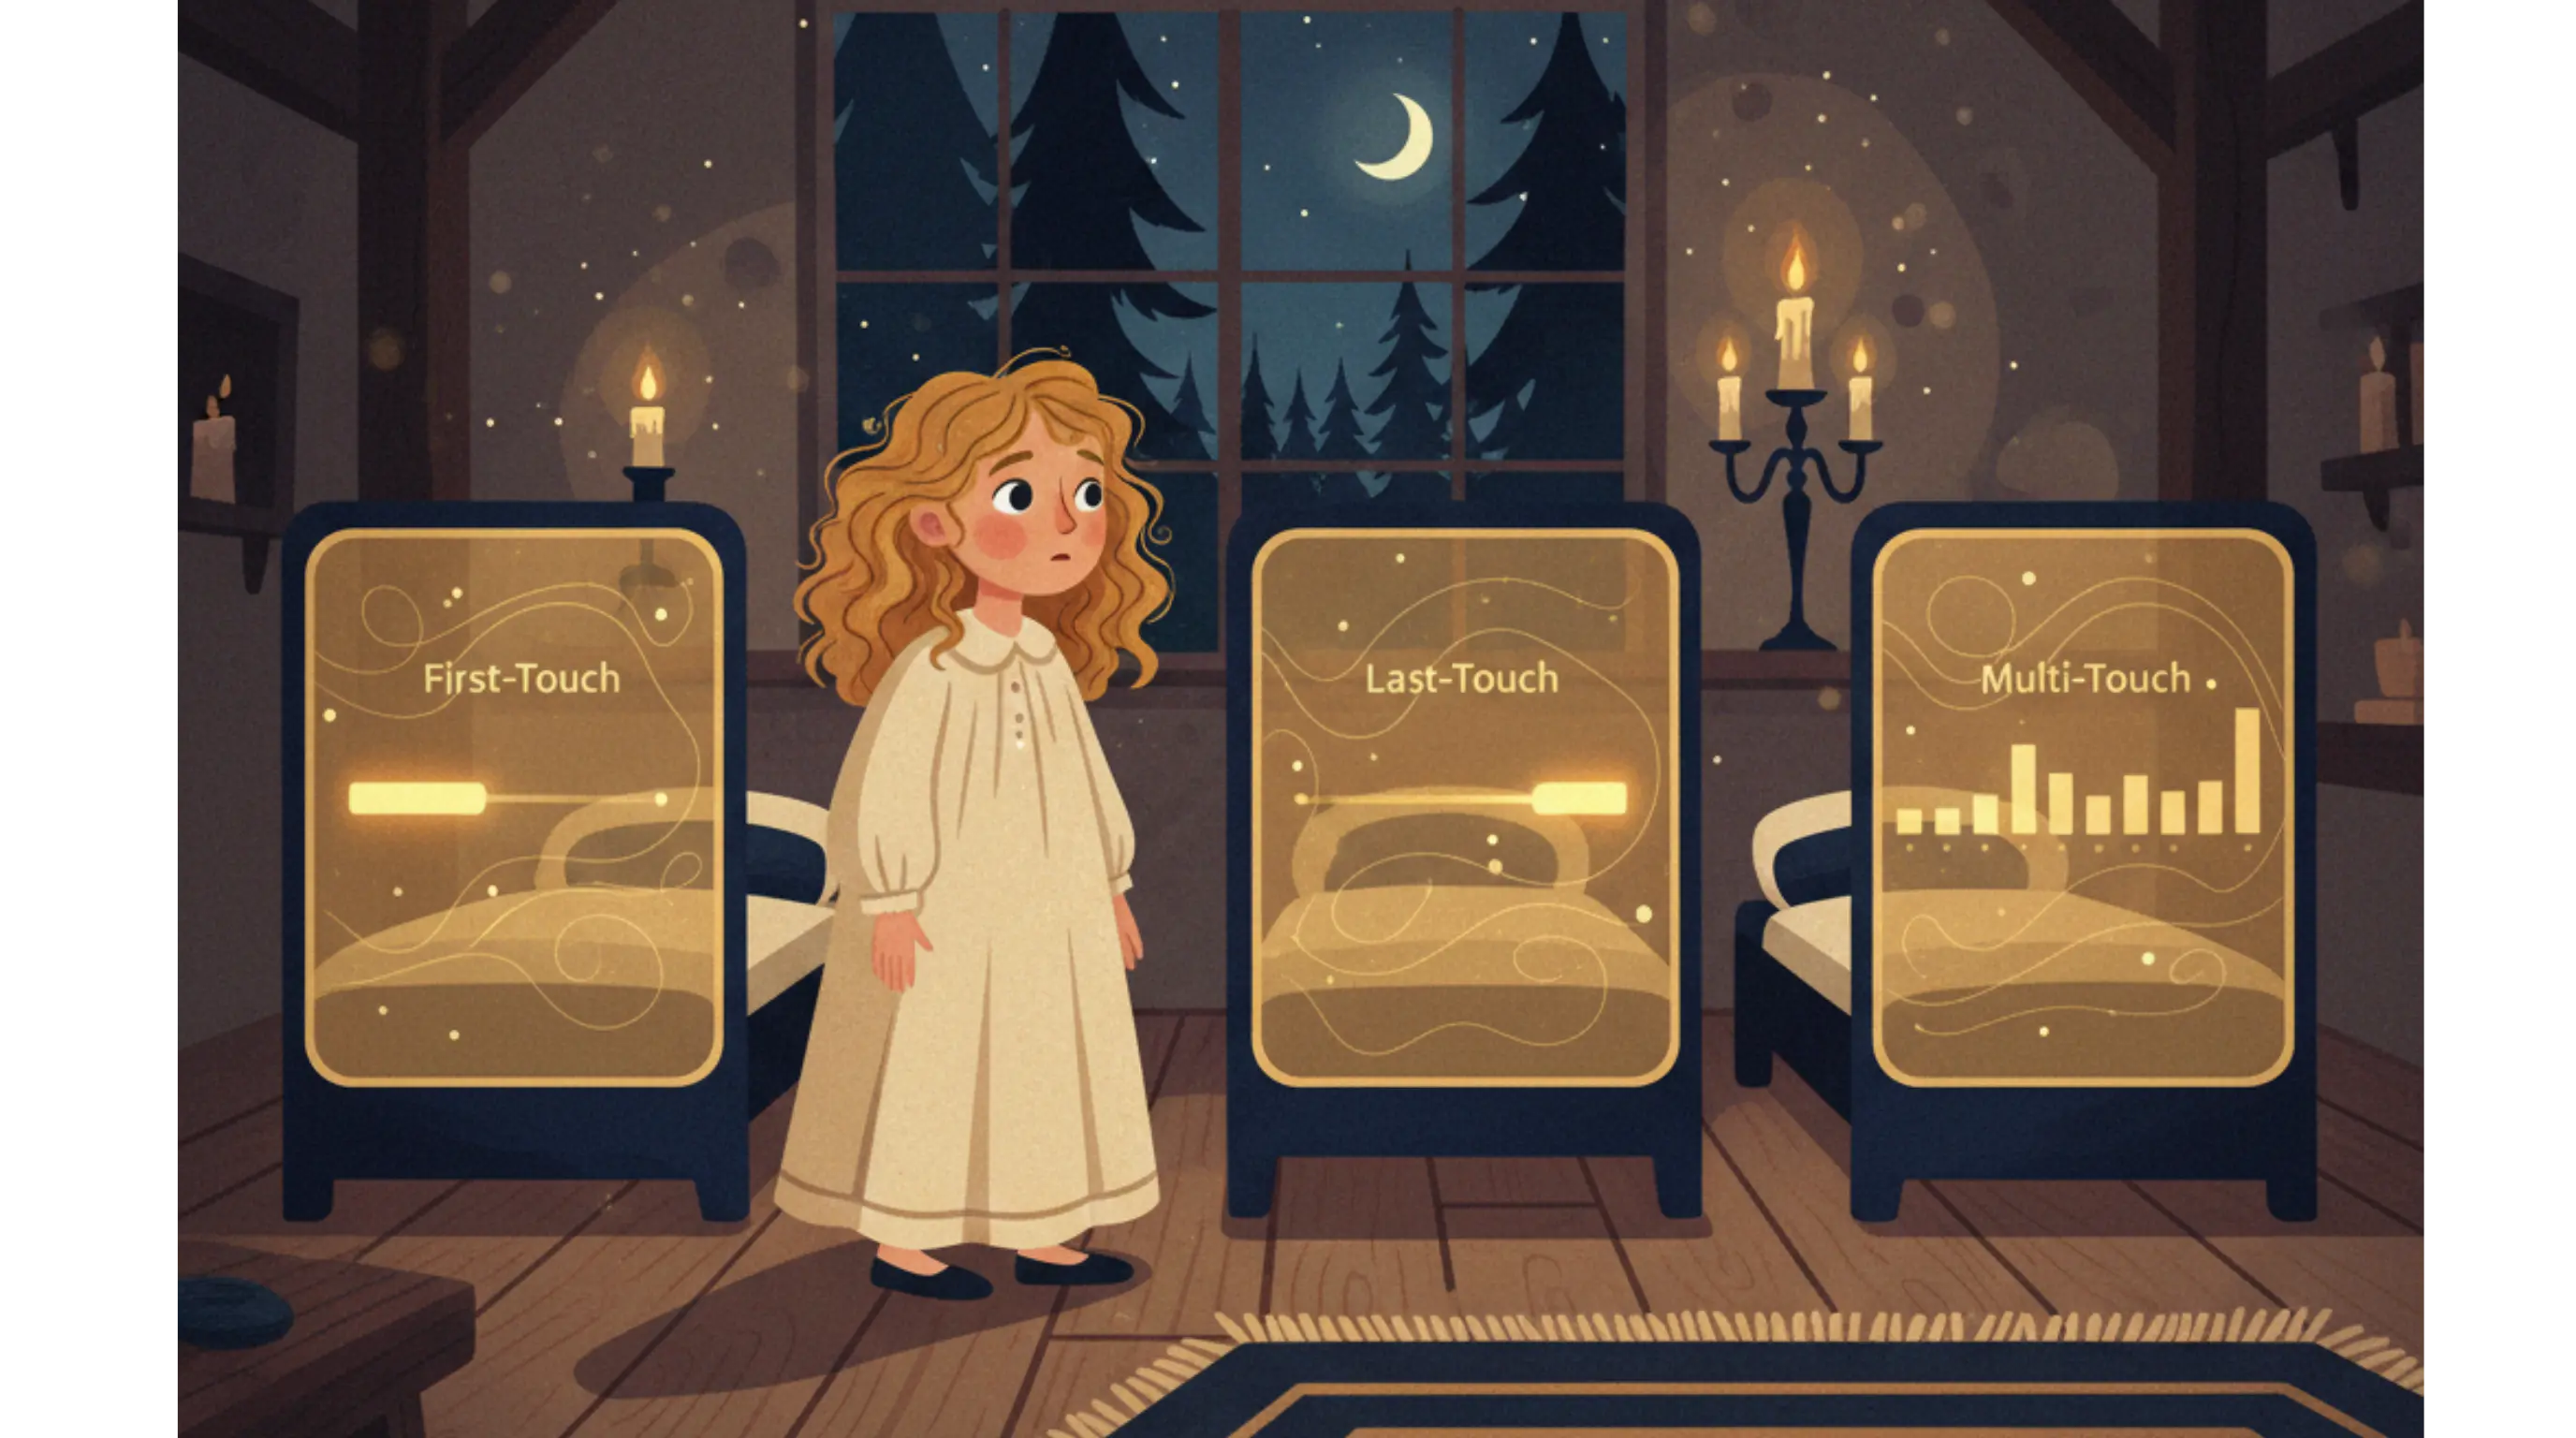
🐻 Papa Bear: the First-Touch model
Papa Bear is large, imposing, and holds a very clear worldview: whoever opened the door deserves all the credit.
In attribution terms, this is called first-touch: 100% of the conversion value is assigned to the first point of contact the customer had with the brand. The Google Ads that appeared when they first searched for the product. The organic post that caught their eye in the feed. The billboard, if you could track it.
The logic has a certain poetic coherence. Without the open door, Goldilocks never would have entered. Without the first touchpoint, there is no journey.
The problem is that opening the door is not the same as closing the sale. The first-touch model systematically overvalues awareness channels and ignores everything that happens in the middle and end of the journey — the nurturing email, the retargeting ad that brought the customer back, the product page that finally convinced them. It is a useful model for understanding how customers discover the brand. It is a dangerous model for deciding where to cut budget.
🐻 Mama Bear: the Last-Touch model
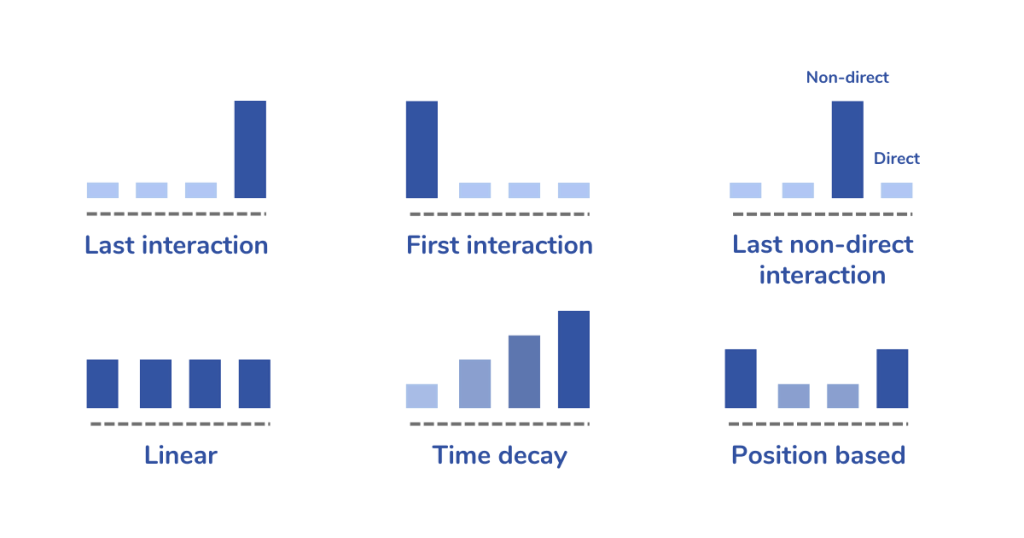
Mama Bear takes the opposite stance. For her, what matters is who closed the deal. The last step. The final click.
In marketing, this is last-touch: all conversion credit goes to the last channel the customer interacted with before purchasing. In practice, it was Google Analytics’ default model for years and remains the most widely used today — especially among companies that never questioned the tool’s default settings.
Its prevalence has a prosaic explanation: it is simple to implement and simple to communicate. “This channel generated X dollars in sales” is a sentence every manager understands.
What that sentence does not reveal is that the last click was rarely the most important one. The customer who buys via a remarketing email had already seen your product somewhere else. Someone planted that seed. Last-touch hands the trophy to whoever cut the ribbon — and forgets the engineers who built the bridge.
In high-ticket or long sales cycle categories, last-touch can be particularly misleading: the customer researched for weeks, consumed content, compared competitors, received a recommendation from a colleague — and converted on an email sent at just the right moment. The model will credit the email. Reality is more complex.
🐻 Baby Bear: models with arbitrary fixed weights
Baby Bear represents a natural evolution: instead of concentrating everything at a single point, let’s distribute.
This is where multi-touch models with fixed weights come in: linear (equal credit to all touchpoints), time decay (more credit to more recent contacts), U-shaped or position-based (40% to the first, 40% to the last, 20% distributed across the middle), and variations like W-shaped (which adds weight to the moment the lead was qualified).
These models are an honest step in the right direction. They acknowledge that the journey has multiple actors. The problem is that the credit distribution is still arbitrary — it is not derived from the data, it is imposed upon it. Why 40-20-40? Why not 50-10-40? There is no empirical answer. It is a philosophical choice dressed up as analysis.
Baby Bear’s bed: better than the others, but still not just right.
The blind spots no bear can see
Before moving on to more sophisticated models, it is worth pausing to name what all classical models ignore.
Invisible touchpoints. Goldilocks arrived at the bears’ house for a reason. Someone may have mentioned it. She may have seen a sign. No bear was tracking that moment. In marketing, these are the offline conversations, word-of-mouth referrals, articles read without a cookie, organic searches without a login. These touchpoints exist — and they influence — but they do not appear in any report.
Survivorship bias. We only analyze journeys that ended in conversion. What about the Goldilockses who left before falling asleep? The customers who got halfway through the funnel and disappeared? Attribution models are built on winners and ignore the drop-offs — which systematically distorts our understanding of what works.
The post-conversion escape. In the story, Goldilocks falls asleep — and flees when the bears return. She converted, but she did not come back. Most attribution models are obsessively focused on the first conversion and blind to what comes after: repurchase, LTV, churn. Attribution credit of zero for the most comfortable bed she ever found.
Beyond the bears: algorithmic models
There are approaches that attempt to overcome the arbitrariness of fixed weights by deriving credit distribution from the data itself.
Shapley Value, originating from cooperative game theory (and recognized with the Nobel Prize in Economics in 2012 through Lloyd Shapley’s work), answers the question: what is the marginal contribution of each channel, considering every possible combination of channels in which it appears? If Google Ads appears in 80% of converting journeys, but removing it causes conversion rates to drop by only 5%, its real credit is lower than its presence suggests. The model is mathematically elegant and respects the interdependency between channels.
Markov Chain approaches the problem differently: it models the journey as a sequence of states (channels) and calculates the transition probability between them until reaching conversion. The most powerful insight is the so-called removal effect: you simulate what would happen to the conversion rate if a specific channel were removed from the system. It is a way of answering “what if?” based on real behavioral data — not assumptions.
Both models are more honest. And both have limitations: they require significant data volume to produce stable estimates, are harder to explain to stakeholders, and still operate within the trackable ecosystem — meaning they do not solve the invisible touchpoints problem.
There is no one-size-fits-all bed
We have arrived at the central point.
The question marketing managers frequently ask — “which attribution model should I use?” — is poorly framed. The right question is: what characterizes my customer’s purchase journey, and which model best captures that reality?
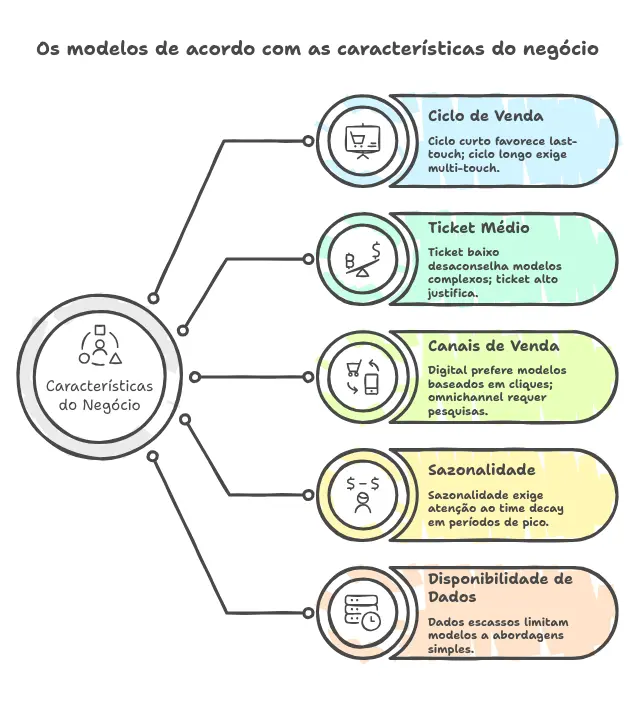
This depends on concrete variables:
| Business characteristic | Implication for the model |
|---|---|
| Short sales cycle (e-commerce, impulse) | Last-touch may be sufficient; the journey is simple |
| Long sales cycle (B2B, high ticket, services) | Multi-touch or algorithmic; the journey has many actors |
| Low ticket | The cost of implementing complex models may not pay off |
| High ticket | The investment in more sophisticated models is justified |
| Predominantly digital mix | Click-based models work better |
| Omnichannel (online + offline) | Click models are insufficient; consider surveys or MMM |
| High seasonality | Watch out for time decay; it can distort during peak periods |
| Scarce or fragmented data | Simpler models are more stable; complexity without data is noise |
There is no model that wins across all dimensions. There is the model that best serves the specific context — and that choice is the manager’s responsibility, not the tool’s.
The logic of experimentation: how to test and calibrate
Finding the right model for your business is not a one-time decision — it is an iterative process. A practical way to start:
Run two or three models in parallel using the same historical data. Do not compare absolute numbers — compare the decisions each model would generate. If first-touch says to scale Facebook Ads and the Markov model says to cut it, that divergence reveals exactly where the arbitrary choice creates risk.
Run the qualitative coherence test. Show the model-generated recommendations to your sales or commercial team. Do they recognize the pattern? Does the channel the model identifies as decisive match what they hear from customers? Field intuition is data. Not the only kind — but it should not be ignored.
Accept that the model will change. When the business grows, when the channel mix shifts, when the customer profile evolves — the attribution model needs to be revisited too. The most common mistake is not choosing the wrong model: it is treating any model as definitive.
Back to the story
Goldilocks did not find the right bed by accident or intuition. She tested. She endured the discomfort of trying what did not work — and that was necessary to arrive at what did.
The manager who finds the right attribution model for their business does the same. They do not copy the market benchmark. They do not use the tool’s default setting without questioning it. They test different models, compare the implications, listen to the field, and accept that “just right” is a relative answer — relative to their business, their moment, their data.
And unlike Goldilocks, they do not run away when the bears come home.
Which bear are you using to make decisions today — without having questioned why?
References and further reading
- Shapley, L.S. (1953). A Value for n-Person Games. Contributions to the Theory of Games.
- Shao, X., & Li, L. (2011). Data-driven multi-touch attribution models. KDD ‘11.
- Box, G.E.P., & Draper, N.R. (1987). Empirical Model Building and Response Surfaces. Wiley.
- Dalessandro, B. et al. (2012). Causally motivated attribution for online advertising. AdKDD Workshop.